
 cryptoticker.io

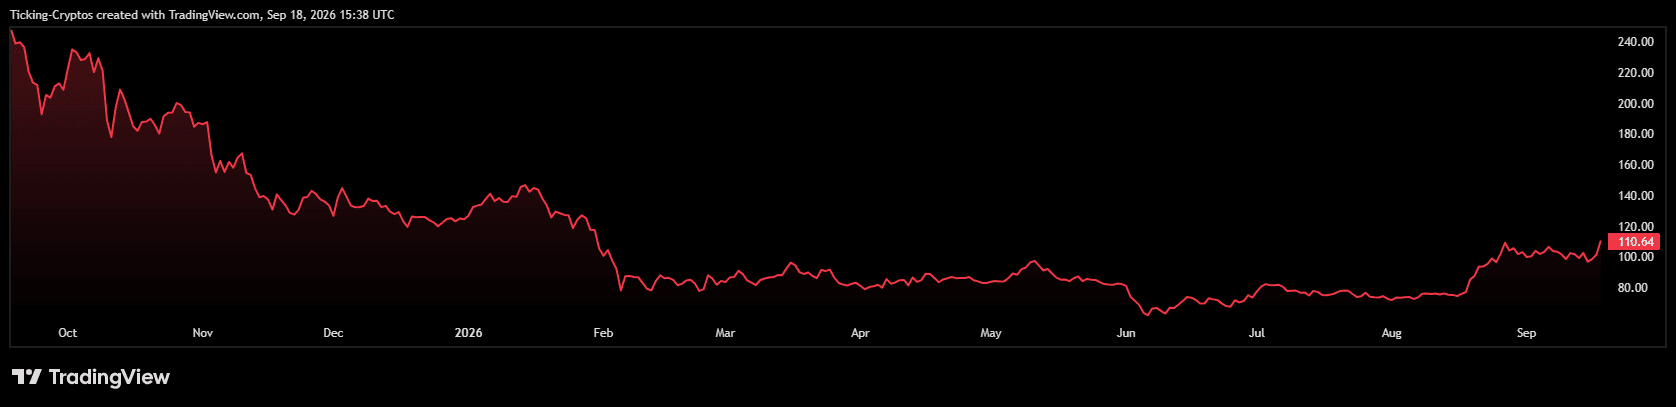
For most of the past year, Solana was a chart nobody wanted to open. From roughly $240 last October it bled almost without pause into a June low near $62. Then in mid-August the whole thing changed in about three sessions, and $SOL has spent the last month doing something it had not done all year: holding above $100.
Where is the $SOL price right now?
$Solana has just tagged $110. That is the top of the range it has traded in since the August breakout, and it is the level this entire setup has been building toward. The session opened at $101.52 with a low of $100.80, so $SOL has swung close to 10% inside a single day.
The floor is the other half of the story. $100 was the ceiling that capped every rally from February through August. It is now acting as the floor. A level that flips from resistance to support is the single most reliable signal in technical analysis, and $SOL has now defended it repeatedly, including a drop to around $95.84 earlier this week when the US Senate failed to advance the CLARITY Act. Even that scare got bought back inside two sessions.
Zoom out and the damage is still obvious. $SOL is roughly 56% below its October 2025 high. But the shape of the chart has changed completely since August.
What does the $SOL chart analysis say about $120?
Look at what happened in mid-August. Solana had been grinding in a tight band between $72 and $85 for six weeks, compressing to barely $75 to $78 by the end of the month. Then it went vertical: through $76, through the 200 EMA, through $90.21, and straight into the $100 handle. Early September printed a high near $110.
The weeks since were spent digesting between roughly $95 and that level rather than giving the move back, which is exactly what a healthy market does after an expansion.
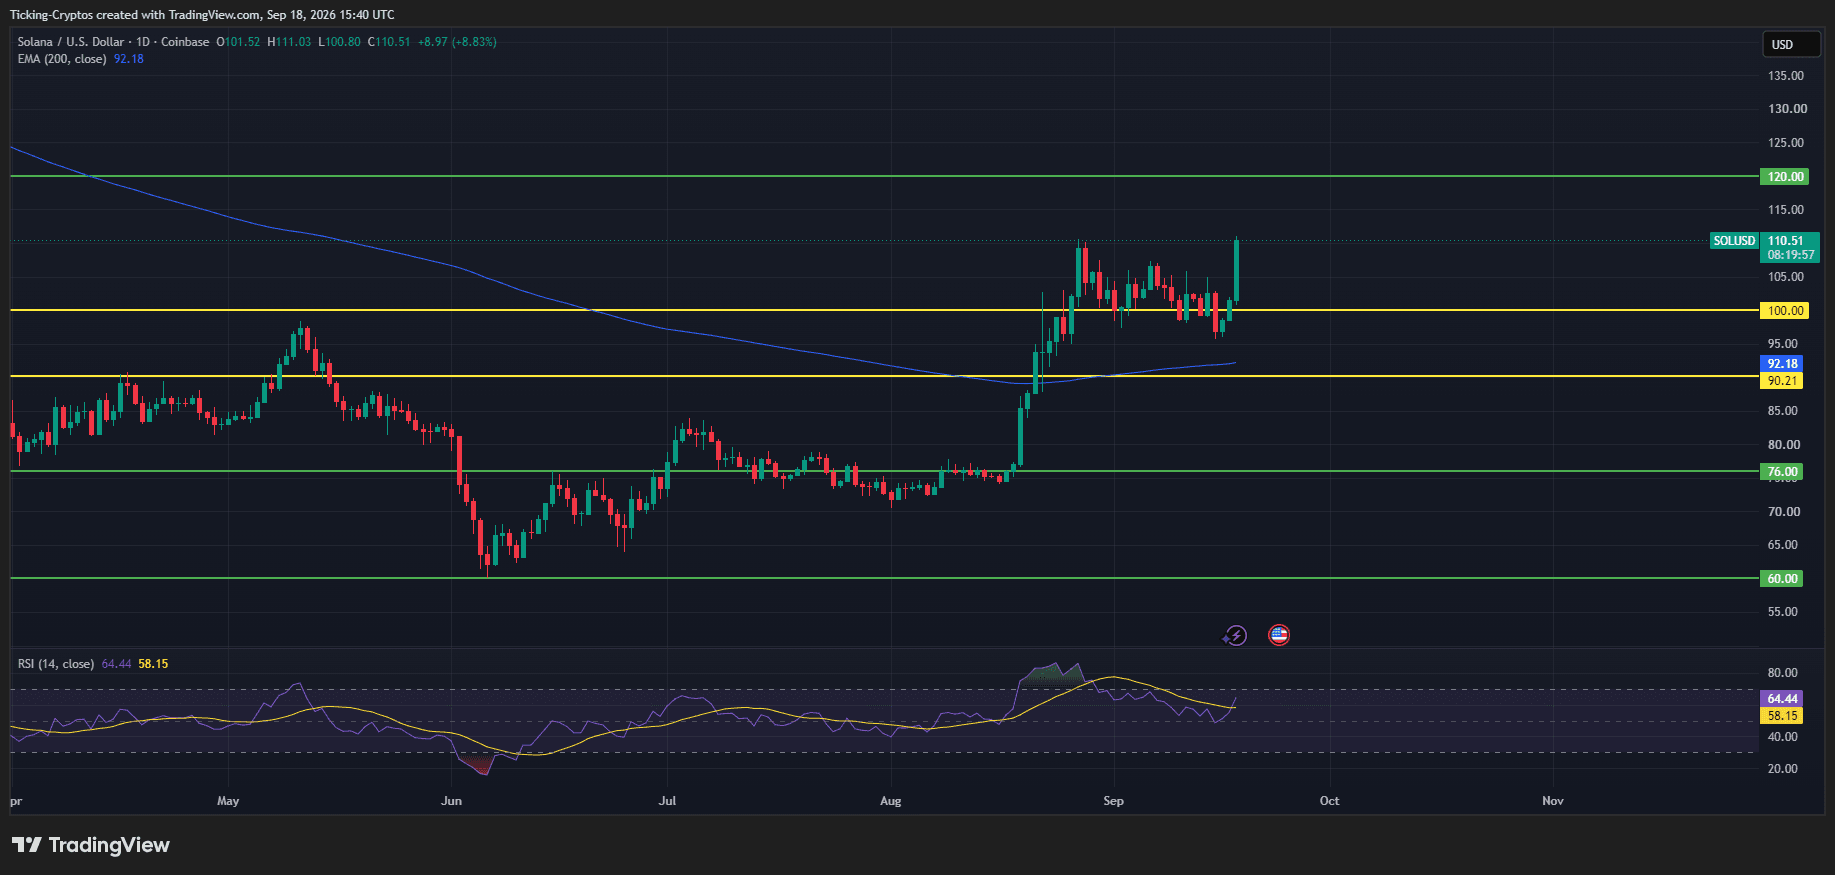
$SOL is now back at the top of that range. Second tests of a range high tend to work far more often than first ones, because the sellers who defended the level in early September have had four weeks to get filled. That is the situation on the screen right now.
The measured move math points at the next target. The multi-month base between $76 and $100 was 24 points wide. A confirmed break above $100 projects roughly $124, which sits right on top of the $120 level drawn on the chart. That is the first real objective, not a stretch goal.
Above $120, the chart thins out fast. The next marked levels are $144.04 and then $160, both of which come from the early-2026 breakdown structure. There is very little traded volume between them, which is why moves through this zone tend to be quick when they come.
Is the 200 EMA finally working for Solana instead of against it?
This is the piece most people are missing.
The 200-day EMA sits at $92.13. For the entire first half of the year it sloped down, and it rejected $SOL on every single attempt to recover. Solana is now trading about 15% above it, and the line itself has flattened and started to curl upward for the first time in 2026.
That is the difference between a relief bounce and a structural change. A rising long-term average underneath price turns pullbacks into entries rather than exits.
RSI supports the setup without overheating. The 14-period reading is 60.18, sitting above its own signal line at 57.84. That is firmly in bullish territory with no overbought condition, meaning there is room for another leg before momentum needs a rest.
Are ETF flows and the network upgrades enough to get $SOL there?
The fundamental backdrop has improved more quietly than the price.
US spot Solana ETFs have now recorded nine consecutive weeks of net inflows, with more than $200 million arriving in the past month alone. The latest reading put the 30-day total at $220.1 million and cumulative net inflows at roughly $1.37 billion. The nine products tracked by SoSoValue held about $1.41 billion in net assets in early September. Flows are not explosive, but they are persistent, and they held up through the CLARITY Act disappointment.
Regulatory positioning also improved. On 5 September the SEC formally named $SOL a core ETF asset alongside Bitcoin and Ether for commodity-based trusts, which matters far more for future product launches than for today's candle.
On the technical side, the roadmap is dense. Transaction V1 went live on 9 September, raising the maximum serialized transaction size from 1,232 to 4,096 bytes and opening the door to ZK proofs and more complex on-chain operations. A phased rent reduction started on 31 August, targeting roughly 90% lower on-chain storage costs across five stages.
The big one is Alpenglow, the largest consensus overhaul in Solana's history. It retires Proof of History and Tower BFT in favour of Votor and Rotor, cutting transaction finality from about 12.8 seconds to roughly 150 milliseconds and freeing up around three quarters of block space currently consumed by validator votes. Mainnet activation is targeted for October 2026 with the Agave 4.3 release.
An October catalyst landing while price sits just under a breakout level is a setup worth respecting. If you are positioning for it, it is worth checking fees and $SOL spreads first, since the difference between venues eats into a 20% move faster than most people expect. Our updated table lets you compare the best crypto exchanges side by side.
What would invalidate this Solana price prediction?
First, a rejection at $110 is not a failure. It simply resets the range and sends $SOL back toward the middle of it. Range highs are rarely taken on the first or second attempt.
The level that actually breaks the thesis is $100. That is the whole case in one number: the breakout level, the flipped resistance, and the line that has now been defended more than once.
A daily close back below $100 puts the 200 EMA at $92.13 in play, immediately followed by the $90.21 shelf. Lose both and the August breakout starts to look like a liquidity grab rather than a trend change, with $76 as the next structural support underneath.
The risks are not only technical. $SOL inflation still runs near 3.7%, the active validator count has fallen to roughly 800, which raises fair questions about centralisation, and Alpenglow has already slipped once from September to October. Upgrades that slip tend to slip again.
Solana price prediction: how realistic is $120?
Analyst views are spread wide. Chart-based targets cluster around $140 if the current bull flag resolves upward, while long-horizon models put $SOL's base case far higher and are therefore close to useless for a September or October decision.
The chart gives the cleaner answer, and it is no longer hypothetical. Solana does not need a new narrative to reach $120. It needs a daily close above $110 rather than a wick through it, and then the measured move, the rising 200 EMA, the RSI position and the October upgrade catalyst all point the same way. Tagging the level was the easy part. Closing above it on real volume is the confirmation, and that is what to watch into the weekly close.
Fail to hold $100 and none of that matters. Ranges resolve in both directions, and this one has not resolved yet.