Daily Structure: A Textbook Bullish Setup
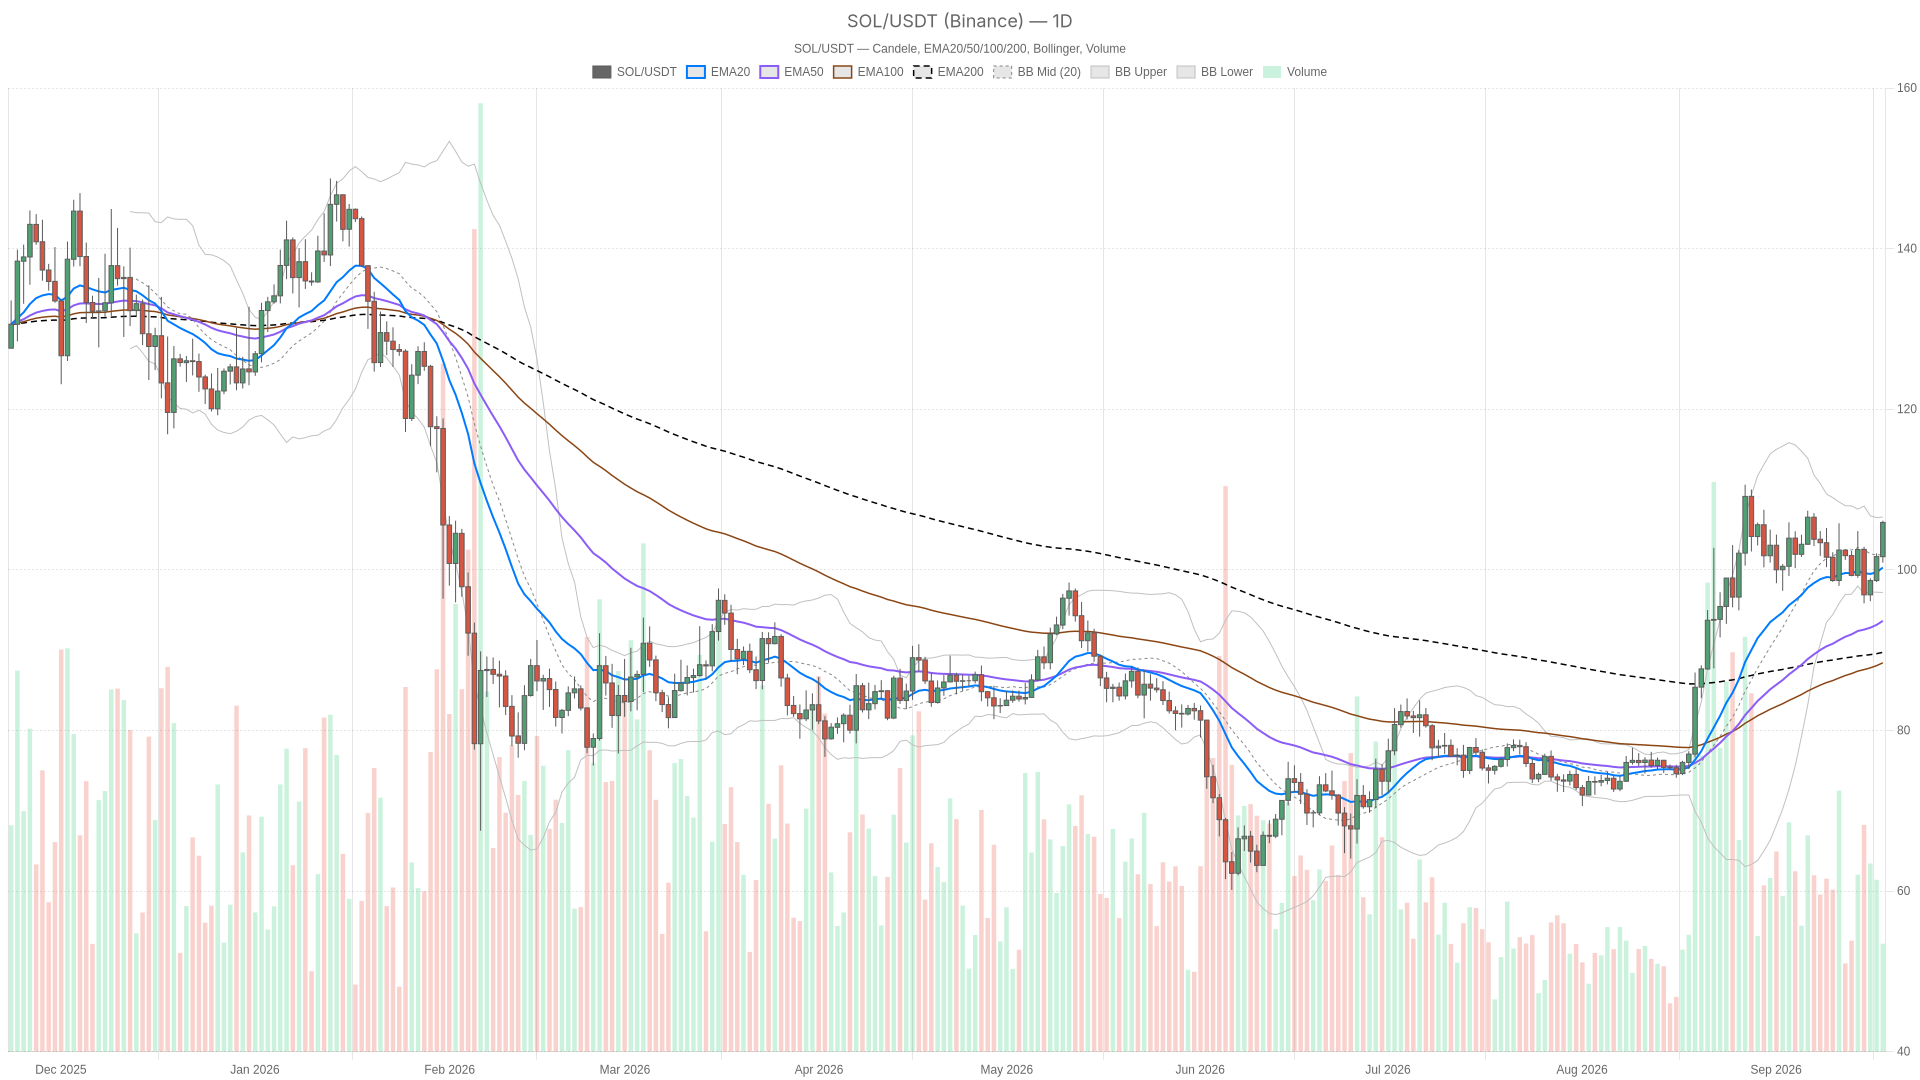
On the daily timeframe, Solana crypto closed at $105.90, comfortably above the EMA20 at $100.28, the EMA50 at $93.64, and the EMA200 at $89.72. That kind of stacked EMA alignment — price above short-term average, short-term above medium-term, medium-term above long-term — is as textbook a bullish configuration as one can find, and it is the reason the system reads the daily regime as outright bullish.
RSI14 on the daily sits at 60.18. That is constructive, not extreme — it shows the market has room to keep climbing without immediately screaming overbought on the higher timeframe. However, the MACD tells a slightly more cautious story: the MACD line is at 2.49, below its signal line at 3.25, leaving a negative histogram of -0.76.
In plain terms, momentum is decelerating even as price keeps grinding higher. That is a classic early-warning divergence pattern — not a reversal signal by itself, but a flag that the rally’s underlying thrust is cooling off while price remains near its highs.
The Bollinger Bands reinforce that picture. Price at $105.90 is pressing right against the upper band at $106.56, with the mid-band at $101.87 and the lower band down at $97.18. Being glued to the upper band during an uptrend is normal and often bullish, but it also means there is very little room left before price needs either a breakout confirmation or a pullback toward the mid-band to reset.
Daily ATR14 stands at $4.25, a meaningful range — enough to remind traders that a stretch of a few percent in either direction would not be unusual here. Daily pivot levels place the pivot point at $104.31, with resistance R1 at $107.71 and support S1 at $102.49, a fairly tight band that will likely define the next decisive move.
Lower Timeframes: Momentum Is Getting Ahead of Itself
Zooming into the hourly chart, the bullish read gets stronger on structure but noticeably more stretched on momentum. EMA20 ($102.81), EMA50 ($101.12), and EMA200 ($100.94) are all trading below spot, confirming the short-term uptrend. However, RSI14 on the 1H is at 80.62 — deep into overbought territory. The MACD line at 1.53 is above its signal at 1.14, with a positive histogram of 0.39, so momentum remains technically constructive. That said, an RSI reading north of 80 on the hourly tends to precede at least a short cooling-off period, even inside a healthy uptrend.
The 15-minute chart adds to that picture of exhaustion at the margin. RSI14 is at 81.58, even hotter than the hourly. The MACD line (0.91) has slipped just under its signal (0.94), producing a barely negative histogram of -0.03 — essentially flat, and a sign that the most immediate push higher is losing steam right at the point of maximum overbought pressure.
Price at $105.93 is sitting almost exactly on the 15m pivot point of $105.90, wedged inside a narrow S1–R1 band of $105.78 to $106.05. That is a market holding its breath at the execution level, waiting for either a fresh trigger or a reason to unwind some of the froth.
Reading the Timeframe Conflict
This is where the analysis needs to be honest about disagreement rather than paper over it. The daily chart is the trend authority here, and it is unambiguously bullish with an RSI that still has room to run. However, both the 1H and 15m charts are flashing overbought extremes with fading or flattening momentum.
That combination usually means one of two things: either the daily trend absorbs a short-term pullback and continues, or the lower-timeframe exhaustion is an early tell for a broader daily-level cooldown. Right now, the honest read is that the bigger trend has not broken, but the risk of a near-term stall or retracement is elevated precisely because of how extended the shorter timeframes have become.
Bullish and Bearish Scenarios
The bullish case rests on the daily structure holding: as long as Solana keeps trading above the EMA20 at $100.28 and the daily MACD histogram stops shrinking, a break through daily resistance at $107.71 would open the door to a continuation leg. This is especially plausible since RSI14 at 60 on the daily still leaves headroom before hitting exhaustion levels seen on the lower timeframes.
This scenario would be invalidated if price loses the $102.49 daily support and closes back below the Bollinger mid-band at $101.87, which would suggest the trend is losing its grip rather than just pausing.
The bearish, or more accurately the corrective, case is built on the overbought readings across the 1H and 15m charts converging with the fading daily MACD momentum. If sellers push price back toward the hourly EMA50 at $101.12 or through the 15m support at $105.78, that would be the first real sign the short-term exhaustion is translating into an actual pullback rather than just a pause.
That case would be invalidated the moment price reclaims the daily pivot at $104.31 with renewed volume and the hourly RSI cools from its current extreme without price breaking down — that would point to a healthy reset rather than a trend change.
On-Chain Activity and Market Sentiment
Broader market conditions add some nuance. According to CoinGecko data, Bitcoin dominance sits at 58.05% of a total crypto market capitalization of roughly $2.68 trillion, which is down 0.65% over 24 hours at the time of writing. The Fear & Greed Index reads 56, classified as Greed — not euphoric, but leaning toward risk-on behavior across the market. That lines up with the kind of overbought stretch showing up on Solana’s shorter timeframes.
On-chain activity tells a mixed but interesting story for the ecosystem. Fee data across major Solana-based DEXs shows sharp divergence: Raydium AMM fees are up 249.88% over 30 days, HumidiFi up 87.98%, BisonFi up 82.02%, and Orca DEX up 59.89% over the same period. These are strong signals of sustained on-chain demand feeding into the broader Solana narrative.
PumpSwap, by contrast, has seen fees fall 52.86% over 30 days and 25.4% in the last 24 hours alone, suggesting activity is rotating between venues rather than uniformly expanding. That kind of rotation is worth watching, since sustained DEX fee growth has historically tracked with periods of stronger token performance for Solana.
Final Read
Putting it together, Solana is in a position where the bigger picture still favors the bulls, but the tape right now is not offering a clean, low-risk entry. Price is stretched against the upper Bollinger band on the daily, deeply overbought on both the 1H and 15m RSI readings, and showing early momentum deceleration on the daily MACD even as trend structure remains intact. That is not a setup that resolves cleanly in one direction — it is a setup that demands patience.
Traders leaning bullish should watch whether pullbacks toward the $102.49–$104.31 zone hold, while anyone skeptical of the extension should watch for a clean break of hourly support as the tell. Given the daily ATR of $4.25 and the general Greed reading across the broader market, volatility in either direction would not be surprising, and position sizing around this level should reflect that uncertainty rather than conviction in a single outcome.
FAQ
What is the key support level for Solana right now?
The most important support zone lies between $102.49 (daily S1) and $104.31 (daily pivot). A close below this band, particularly beneath the Bollinger mid-band at $101.87, would suggest the bullish trend is losing momentum. Above this zone, the daily uptrend remains structurally intact.
Is Solana overbought on the daily chart?
Not on the daily timeframe. The daily RSI14 sits at 60.18, which is constructive and leaves ample room for further upside before reaching extreme levels. The overbought readings are confined to the 1H and 15m charts, where RSI values exceed 80, pointing to short-term exhaustion rather than a daily-level warning.
What does the Fear & Greed Index indicate for current market conditions?
The Fear & Greed Index reads 56, classified as Greed. This suggests the broader market is leaning risk-on without having reached euphoric extremes. It aligns with the stretched short-term readings seen on Solana’s lower timeframes while still leaving room for the daily trend to continue if structure holds.
Disclaimer: This article is for informational purposes only and does not constitute financial advice, an investment recommendation, or a solicitation to buy or sell any financial instrument or cryptocurrency. The analysis provided is not indicative of future results. Investing in crypto assets and financial markets carries a high risk of capital loss. Always do your own research (DYOR) and consult a qualified financial advisor before making any decision.
Article produced with the assistance of artificial intelligence and reviewed by the editorial team.

 en.cryptonomist.ch