
 invezz.com

$BNB price has risen 2.6% over the past 24 hours to around $727 on Sept. 17, recovering from an intraday low near $708.50 as new real-world asset products and recent $BNB Chain upgrades support buying activity.
According to CoinGecko, $BNB was trading at $727.35 at the time of writing, with the token up 2.9% over the past seven days and 20.9% over the past month.
Price briefly moved above $730 during the latest recovery after buyers defended the $708 to $710 area.
One catalyst came from OpenEden, which expanded its tokenised fixed income products to $BNB Chain on Sept. 17.
The deployment brought its TBILL and HYBOND products to the network, giving users access to tokenised US Treasury bills and short dated high yield bonds.
Real world assets on $BNB Chain reached around $5.69 billion, up from $510 million in September 2025, according to OpenEden.
The figures represent an increase of more than 1,000% over the past year and place the latest product launch within a period of rapid growth for tokenised assets on the network.
Network capacity has increased following $BNB Chain's Pasteur hard fork, which went live on Aug. 25.
The upgrade introduced BEP 675 and changed the block building process to reduce redundant transaction execution before blocks are sealed.
$BNB Chain's latest figures put gas processed per block through the BidBlock V2 system around 28% above the previous architecture.
BEP 675 accounted for around 98% of blocks during a recent three day measurement period.
The network has been raising its gas limit as part of the scaling programme, with increases towards 80 million and potentially 90 million planned.
Combined with the growth in tokenised assets, the changes have expanded network capacity while new institutional products have continued to arrive on $BNB Chain.
Derivatives positioning remained active during the price recovery.
As of publication time, CoinGlass data showed $BNB futures open interest near $1.13 billion, while futures trading volume reached around $712 million over 24 hours.
Liquidations remained comparatively small at around $446,000 during the same period.
The figure indicates that forced futures liquidations accounted for only a limited portion of the latest price movement, instead of the rise being dominated by a large short squeeze.
$BNB price analysis
$BNB has recovered above its 20 day exponential moving average after the latest pullback, with price around $727 compared with the 20 day EMA at $713.97.
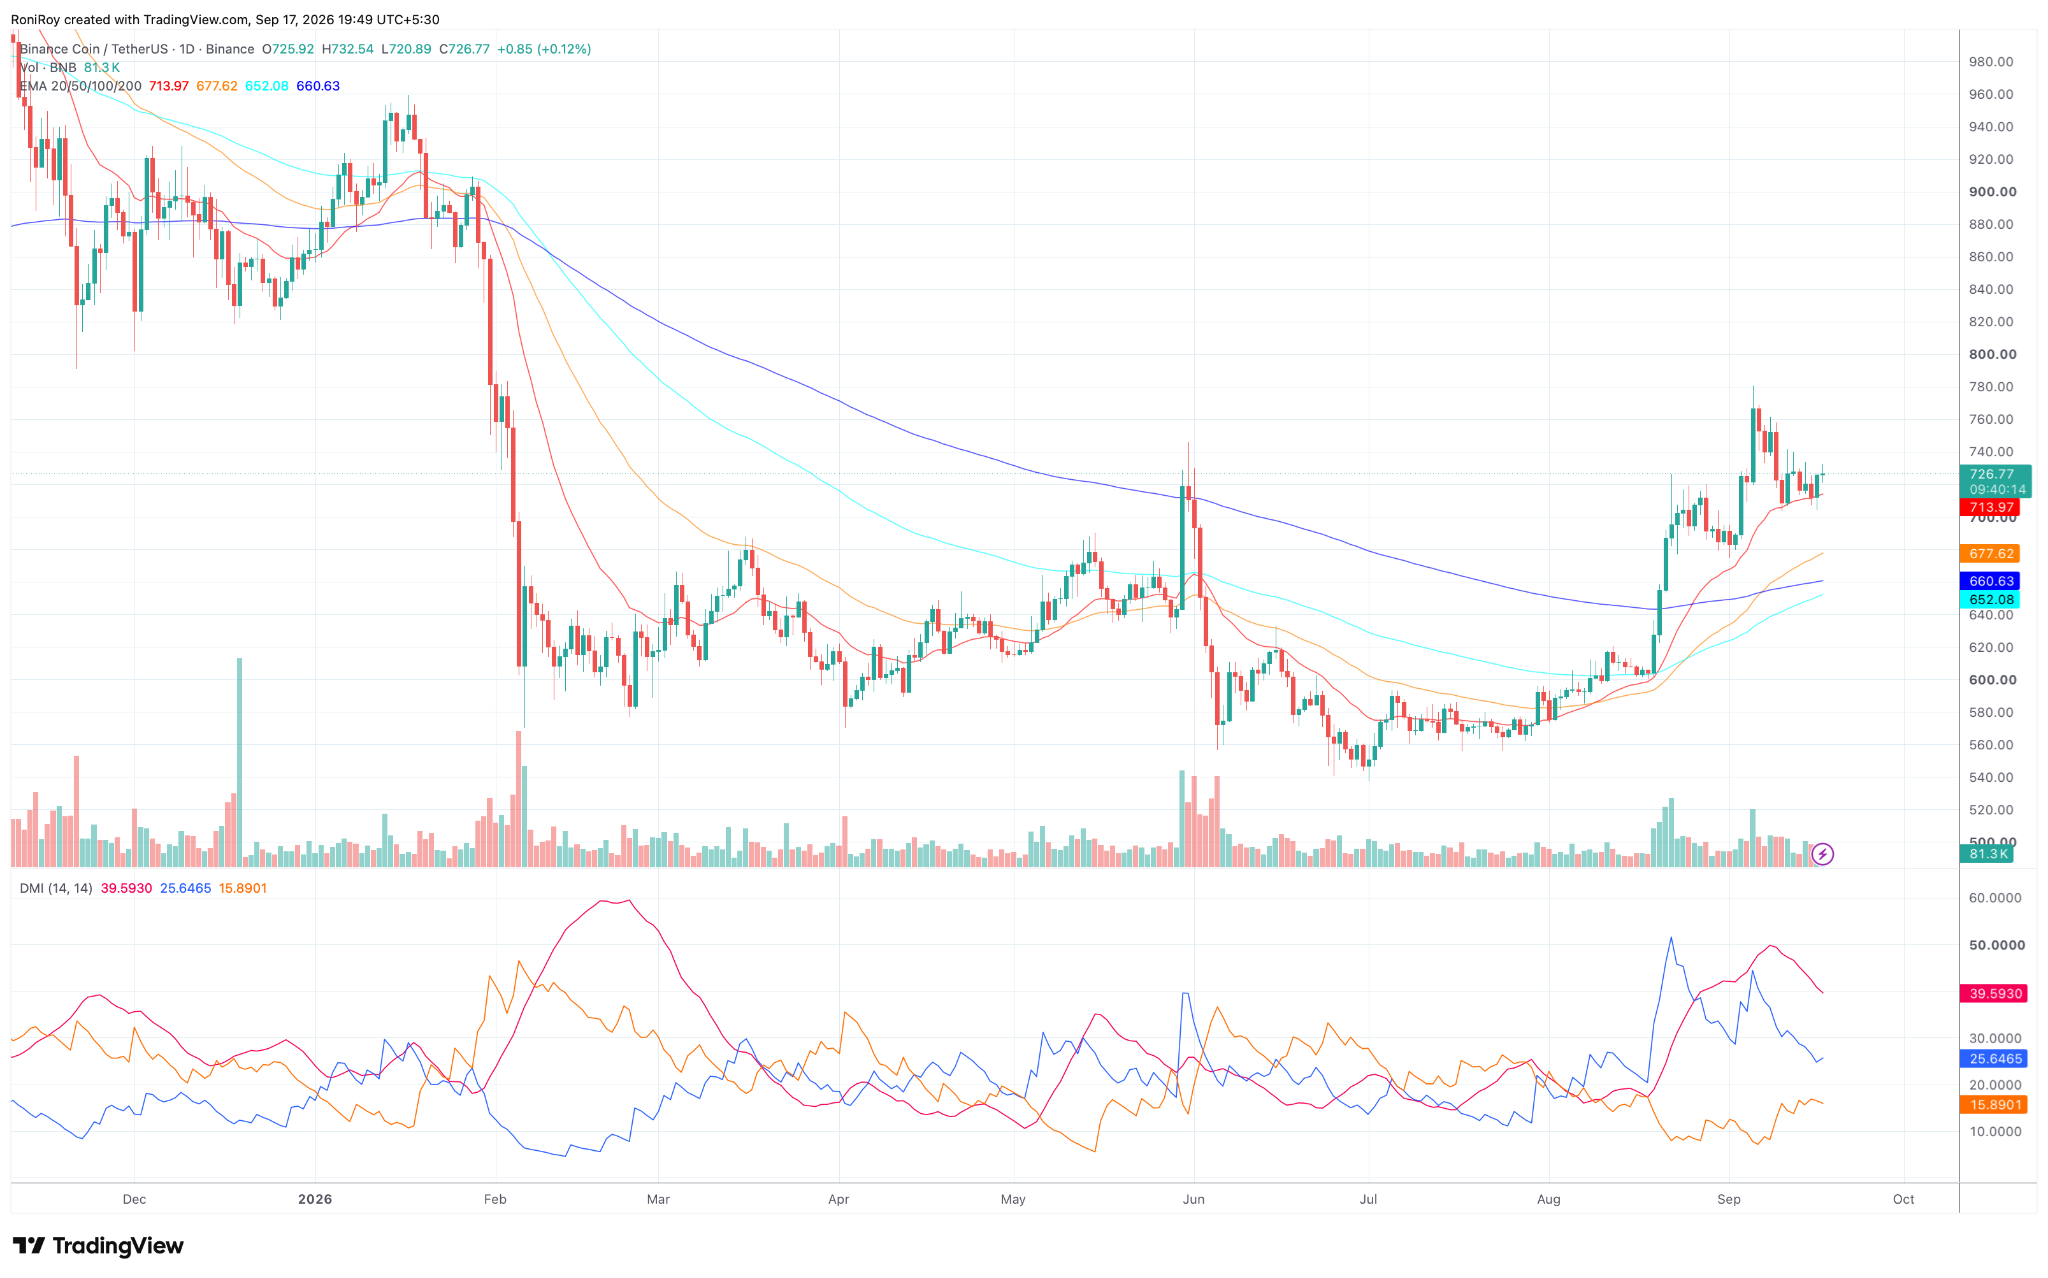
The token remains well above its 50-day EMA at $677.62, 100-day EMA at $652.08, and 200-day EMA at $660.63.
Price moving above all four averages keeps the daily structure tilted upwards, while the 20-day EMA provides the closest dynamic support.
A daily close below $713.97 would weaken the current recovery and put the $708 to $710 support area back into focus.
The Directional Movement Index supports the positive daily trend but shows that its strength has eased from the levels reached during the early September move.
ADX stands at 39.59 after retreating from close to 50, while the positive directional indicator at 25.65 remains above the negative directional indicator at 15.89.
An ADX reading near 40 still indicates a well-established trend, and +DI remaining above −DI keeps buyers in control of directional movement.
The declining ADX means the trend is no longer strengthening at the pace seen earlier in September, making resistance above the current price important for the next move.
On balance volume has moved higher to around 575.66 million and is approaching its recent peak while $BNB consolidates below its September high.
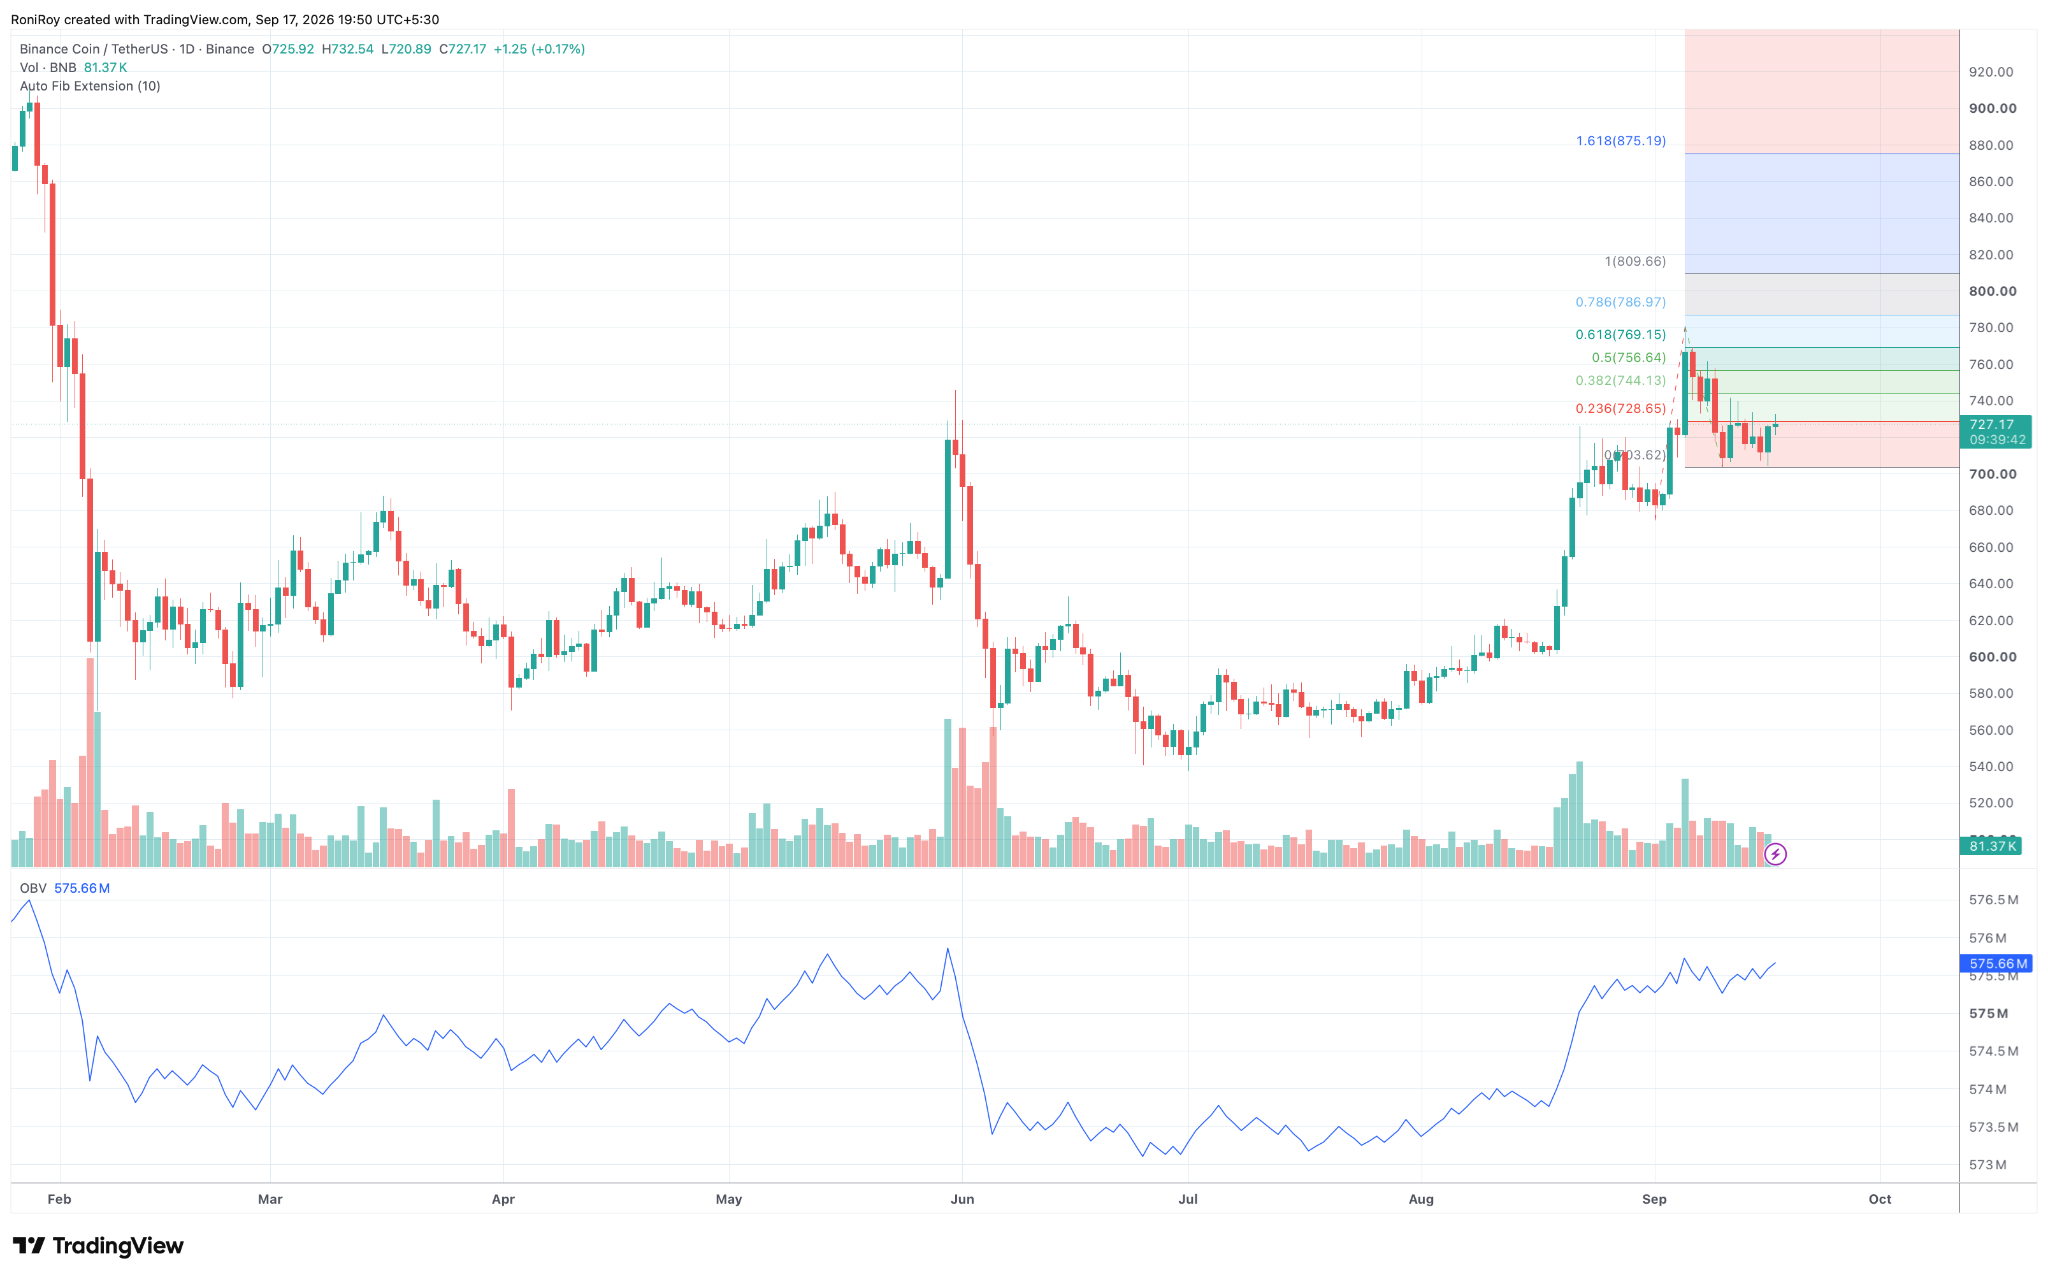
OBV has continued rising through the latest pullback, showing that cumulative volume has remained weighted towards buying days.
$BNB is now trading just below the 0.236 Fibonacci extension at $728.65. A daily move above that level would expose $744.13 at the 0.382 extension, followed by $756.64 at the 0.5 level.
The 0.618 extension sits at $769.15, giving $BNB a probable target near $770 if price clears the $739 to $740 resistance area and buying volume continues to support the move.
Above $769, the 0.786 extension stands at $786.97, while the full extension is positioned at $809.66.
Failure to hold the 20-day EMA at $713.97 would put $708 to $710 back in play.
A break below that area would leave the $703.62 Fibonacci base as the next support, with the 50-day EMA at $677.62 providing a lower target if sellers push $BNB beneath the September consolidation range.