Sellers are continuously transferring more value out than buyers are bringing in over the specified time periods. Crucially, negative spot net flow does not always indicate that $SHIB is going to fail. Rather than being a precise prediction of future prices, these numbers reflect the equilibrium between buying and selling activity on tracked spot markets, depending on the methodology.
Price takes a plunge
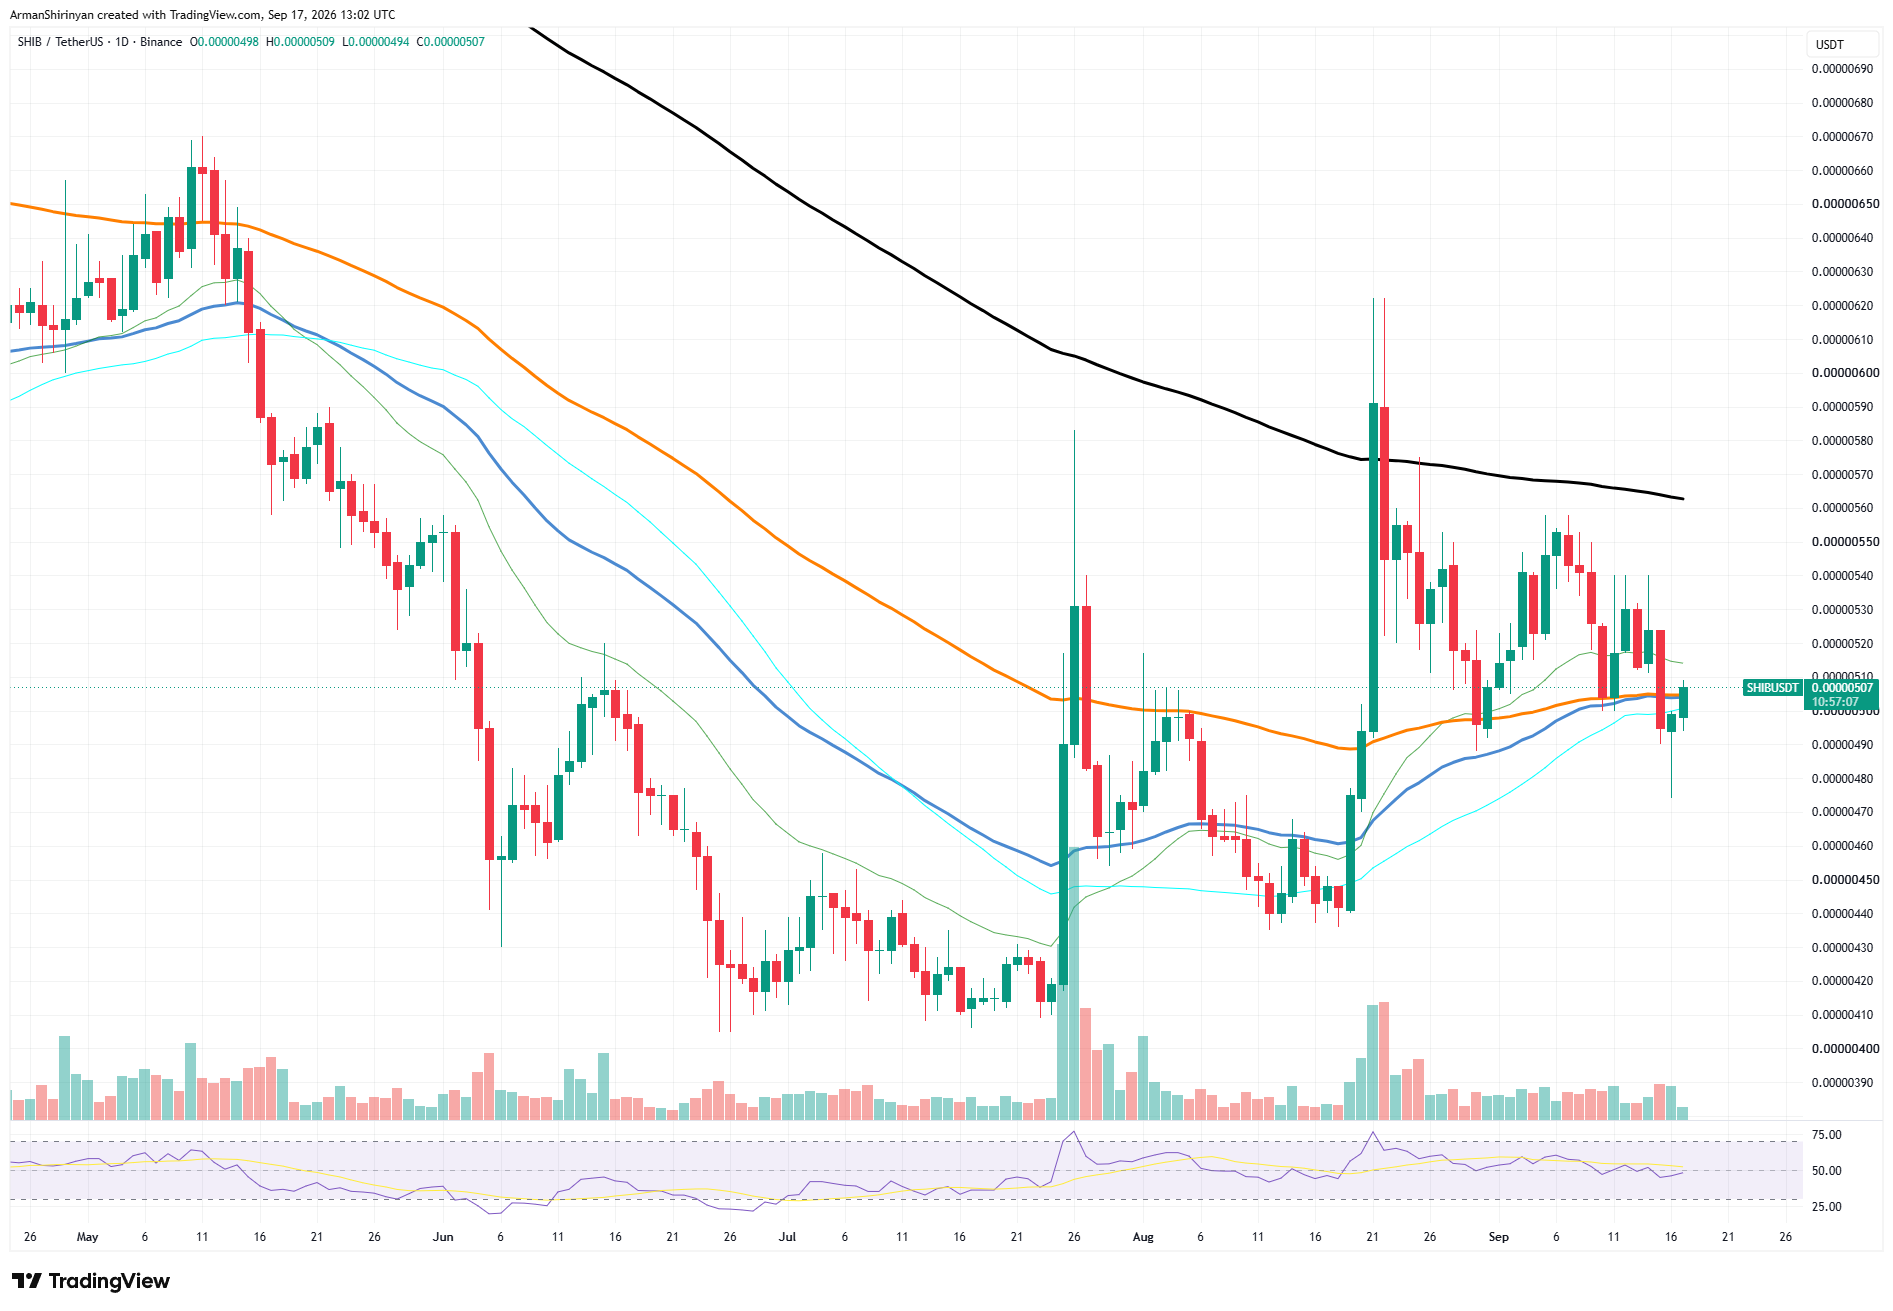
That issue is reflected in the chart. At the moment, $SHIB is trading at about $0.00000507, directly between a number of short- and medium-term moving averages that are grouped around $0.00000495–$0.00000515. This results in a technical setup that is unusually compressed, where the next direction may be determined by relatively small price movements.
The first significant challenge is located between $0.00000515 and $0.00000520. $SHIB has frequently had trouble sustaining its momentum above this region. Stronger resistance is found between $0.00000540 and $0.00000550, which is followed by the declining long-term moving average close to $0.00000565.
On the downside, losing $0.00000490 would expose $0.00000460–$0.00000470 and significantly weaken the structure. The RSI is still close to the neutral 50 range, providing neither side with much momentum support.
As a result, $SHIB is experiencing a demand issue at the exact moment when its technical structure requires increased buying pressure. Another attempt to break above the moving-average cluster may find it difficult to develop into a sustained recovery unless spot flows improve.

 u.today