
 coinedition.com

Gold and Silver, the two top precious metals, saw their prices crash to new five-week lows in the early hours of Monday. The sharp decline wiped out about $650 billion in the market, leaving investors wondering.
The sudden drop in Gold and Silver prices so early in the week surprised many traders, leaving them guessing between a violent correction after the metals’ massive rally and a broader shift in investor positioning as markets reassess Fed policy, inflation, oil prices, and global liquidity as the main reason behind the pullback.
Gold and Silver Aggressive Crash
Spot gold fell 2.80% from Monday’s open, extending its drop since the last week of August to trade at $4.288 at the time of writing, according to TradingView data. The precious metal’s price as of writing reflects a 23.4% pullback from its all-time high in January 2026. Similarly, Spot silver has lost approximately 4.5% of its value during the current trading session, marking a 12.71% decline since the last week of August, and a 48.26% drop from its all-time high in January.
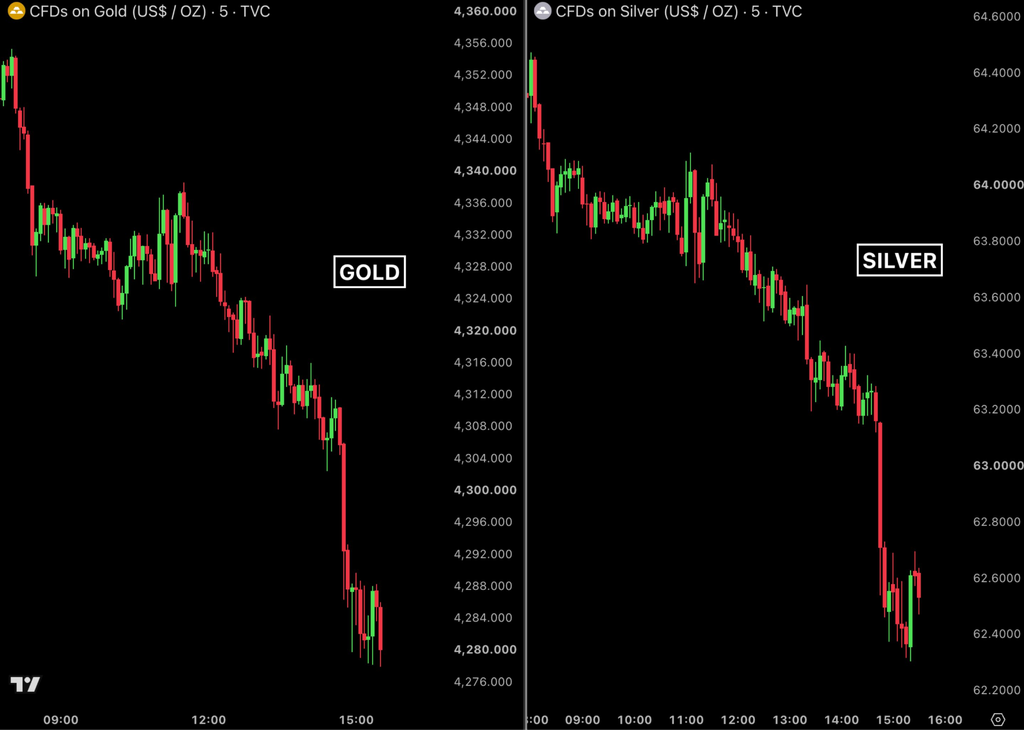
For context, the aggregate paper wealth reduction resulting from the pullback in spot gold and silver prices cascades through physical, institutional, and speculative channels simultaneously, leading to the massive wipeout recorded. The development triggered a contraction in institutional ETF Net Asset Value (NAV), immediate paper wealth destruction, leveraged derivatives liquidation, cascading margin calls that triggered automated selling, Central Bank reserve revaluation, and sovereign balance sheet reduction.
Key Drivers Behind Gold and Silver Crash
Amid the fallout from the sharp decline in spot precious metal prices, traders remain inquisitive about what caused the pullback. The questions are about how much of this pullback is simply a violent correction after a massive rally, and to what extent fundamental factors affect the market.
With the odds of a September interest rate hike surging to 90%, heavy pressure is being heaped on non-yielding assets like gold and silver by fundamentally shifting the opportunity cost of holding them. As a result, large-scale institutional funds are actively rotating away from defensive commodities and reallocated into interest-bearing instruments.
Although precious metals are traditionally viewed as classic inflation hedges, the rising energy costs and hot inflation data are accelerating expectations for aggressive central bank interest rate hikes. This automatically triggers a counterintuitive drop in gold and silver prices. Additionally, a strengthening dollar and higher Treasury yields severely depress spot gold and silver prices because they destroy the latter’s appeal to global investors.
While gold and silver suffer growth concerns simultaneously, the effect is often more severe on the latter, primarily because it has additional exposure to industrial demand. Silver remains a core element in manufacturing cycles, technical engineering, and green-energy infrastructure development.
What is Happening and What is Next?
A combination of macro indicators is pressuring spot gold and silver prices. However, profit-taking from investors remains the immediate mechanical trigger accelerating the crash. As prices pull back from milestone levels, targets recalibrate, and traders capitalize on those to close portions of their positions. Many traders do this to lock in gains, turning a fundamental shift into a rapid market sell-off.
Arguably, the current precious metals selloff represents a deep, temporary technical correction rather than the start of a systemic, multi-asset liquidity unwind. Despite a violent intraday selloff, the broader market architecture shows a classic pre-FOMC asset rotation where capital is temporarily parked in high-yielding cash alternatives rather than a structural cross-asset panic.
As of today, Bitcoin and other digital risk assets have decoupled from precious metals, climbing higher, despite gold’s decline. BTC recorded a 2.48% gain as of writing, reclaiming the $78,000 support amid signs of further rally. Nonetheless, it is not all doom for the spot precious metals, as they can reclaim their broken technical areas. However, they are teetering on critical make-or-break floors.
Key Levels to Watch
Holding the 50-day Moving Average at $4,266 until Wdnesday’s Federal Reserve meeting is crucial for gold. If not, the bearish pressure will intensify, exposing deeper structural support targets at $4,210 and $4,136.
Silver is technically more fragile, as it is currently carving out the neckline of a bearish head-and-shoulders pattern while trading near $62.70 – $62.90. A decisive break below $62.50 will trigger automated sell algorithms, exposing rapid downside extensions toward $61.04 and $60.83.