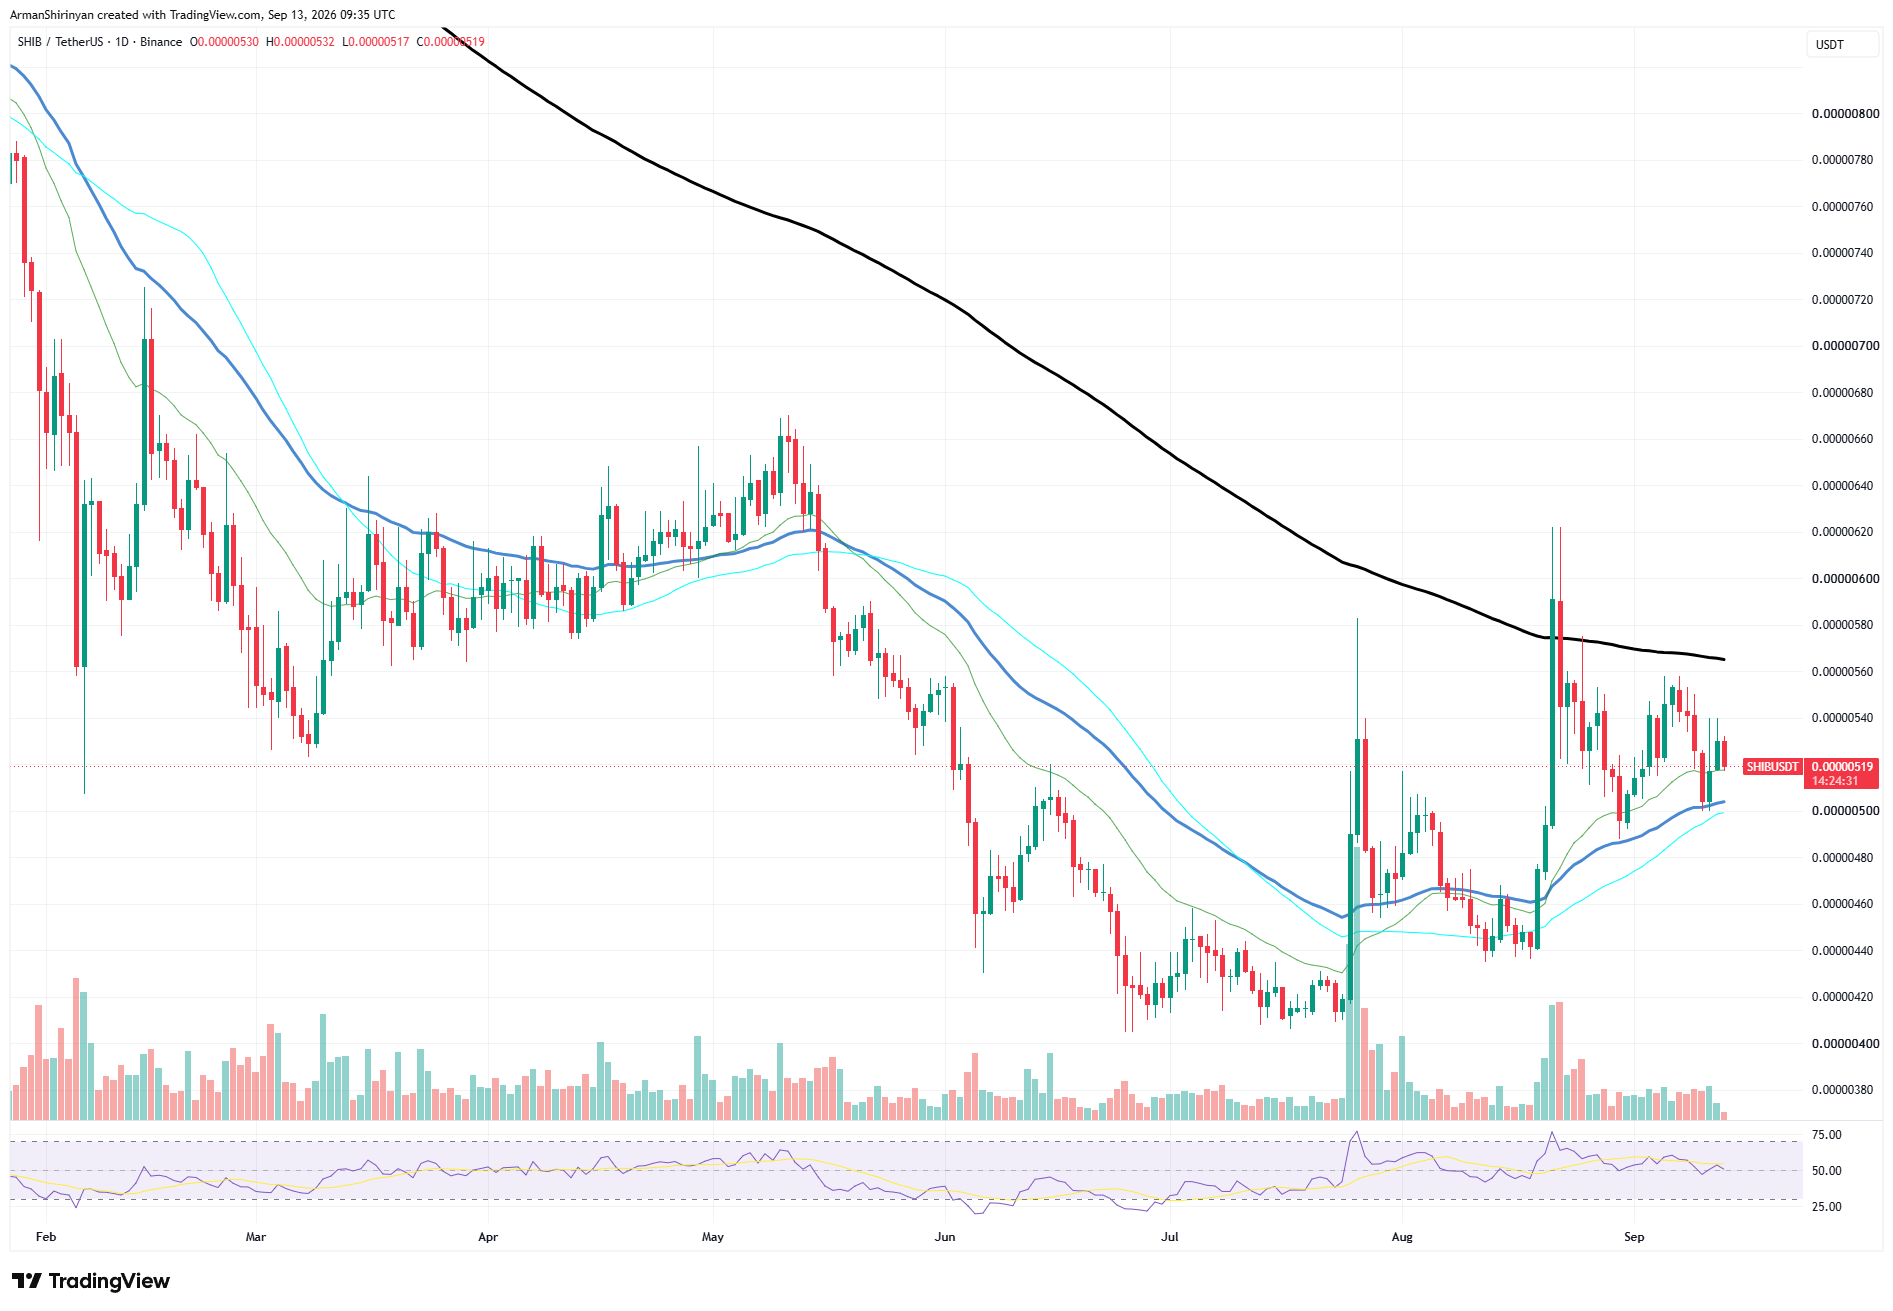
At the moment, $SHIB is trading around $0.00000521. The token has made significant progress since its July low of about $0.0000041, but the recovery has repeatedly stalled before a true long-term trend reversal could develop.
Key barrier for $SHIB
The most noticeable barrier is located between $0.0000056 and $0.0000057, where the long-term moving average is still descending. During its late-August spike, $SHIB momentarily broke above this area, hitting about $0.0000062, but buyers were unable to sustain the breakout. The price swiftly fell back beneath resistance.
Shorter-term conditions are better. An immediate support area is created by $SHIB's current position above a cluster of moving averages around $0.0000050–$0.0000051. Maintaining that cluster allows for another attempt at recovery. However, losing $0.0000050 would weaken the setup and might expose roughly $0.0000047–$0.0000045.
Additionally, momentum offers little assurance. Instead of displaying consistent bullish strength, the daily RSI is sitting in the neutral 50 region. Trading volume has also declined significantly from the spikes that accompanied the rallies in July and August.
For this reason, it is not appropriate to interpret the 42% on-chain increase as a stand-alone bullish signal. Network activity may rise prior to price changes, but it may also rise in the absence of significant buying pressure.
The market itself must still provide confirmation for $SHIB. A sustained move above $0.0000056–$0.0000057, ideally with increased volume and momentum, would provide stronger evidence that rising on-chain activity is translating into real demand.

 u.today