
 coinedition.com
Shiba Inu price prediction for September 11 turns bearish after today’s Supertrend flip, with $0.00000512 the level that decides whether this pullback stays shallow or extends toward $0.00000467.
Shiba Inu Price Analysis: Has the Rebound Run Out of Room?
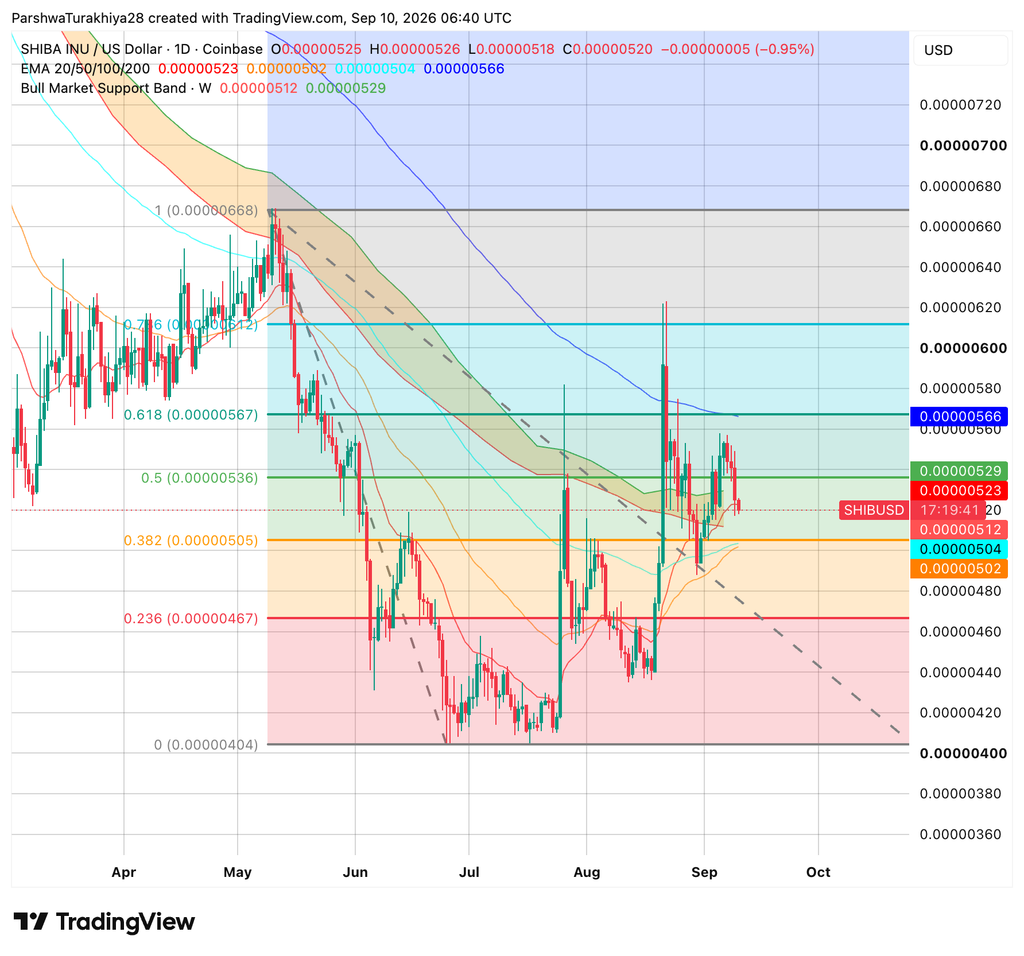
$SHIB trades near $0.00000520, down 0.95% today, pulling back from a spike above $0.0000062 in early September that failed to hold. Price now sits between the 0.382 and 0.5 Fibonacci retracement levels from the April-to-June range, at $0.00000505 and $0.00000536, with the weekly Bull Market Support Band at $0.00000512 to $0.00000529 sitting almost exactly on top of current price.
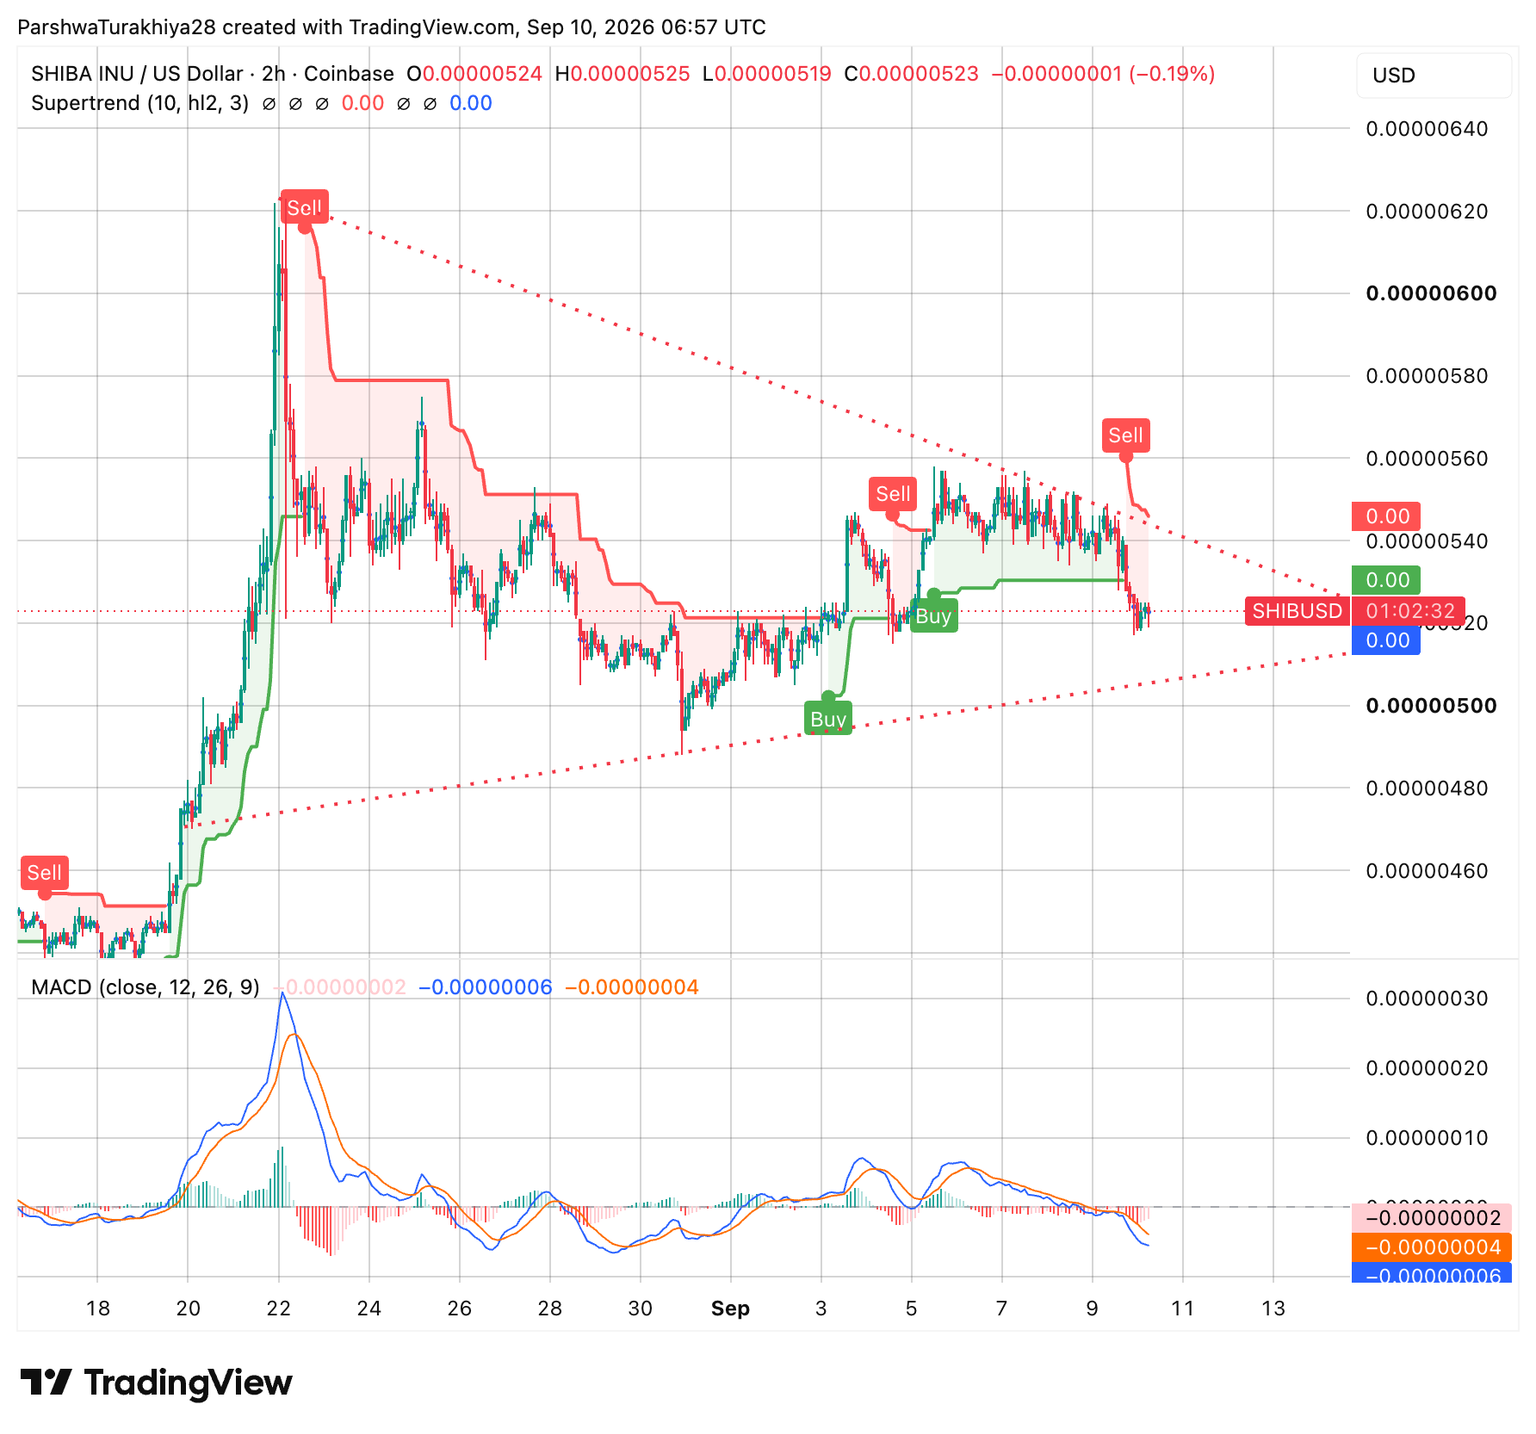
The 2-hour chart shows the more immediate warning sign. The Supertrend indicator, which had flagged a buy near $0.0000050 on September 5, flipped to a sell signal today as price rolled over from a recent high near $0.0000055. MACD backs that up, the MACD line has crossed below its signal line and both sit in negative territory, confirming short-term momentum has turned down after a five-day bounce.
$SHIB Support and Resistance Levels, September 11, 2026
| Type | Price |
| Resistance | $0.00000529 |
| Resistance | $0.00000536 |
| Resistance | $0.00000567 |
| Support | $0.00000512 |
| Support | $0.00000505 |
| Support | $0.00000467 |
$SHIB News: Burn Rate Falls 62% as Individual Burns Shrink to a Few Dollars Each
$SHIB’s burn activity dropped 61.98% over 24 hours, based on tracked burn-rate data, falling from a sustained pace above 8 million tokens per hour to under 2 million before a partial recovery to around 3.5 to 4.5 million by the next morning.
Related: Crypto Price Prediction: Raydium (RAY), $NEAR Protocol ($NEAR), and $IOST ($IOST)
The most recent individual burns tell the same story at the transaction level: a string of transfers worth $1 to $3 each from Robinhood and unlabeled wallets, with one larger $7.27 burn from Binance. At $SHIB’s current supply in the hundreds of trillions, burns this size remove an economically negligible amount of tokens regardless of the percentage swing in the rate.
$SHIB News: Exchange Netflow Turns Positive After Months of Outflows
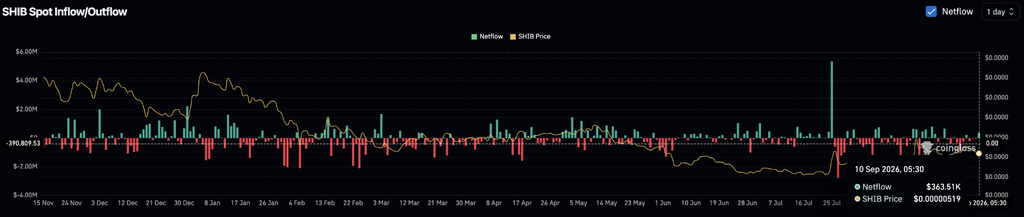
$SHIB’s spot exchange netflow read positive $363,510 as of today, according to Coinglass data, a reversal after a stretch of mostly negative netflow readings that ran from around March through July.
A single day of inflow doesn’t confirm a new trend, but it’s worth watching alongside today’s price pullback, since coins moving onto exchanges typically precede selling rather than holding.
Shiba Inu Derivatives: Longs Absorb Most of Today’s Liquidations
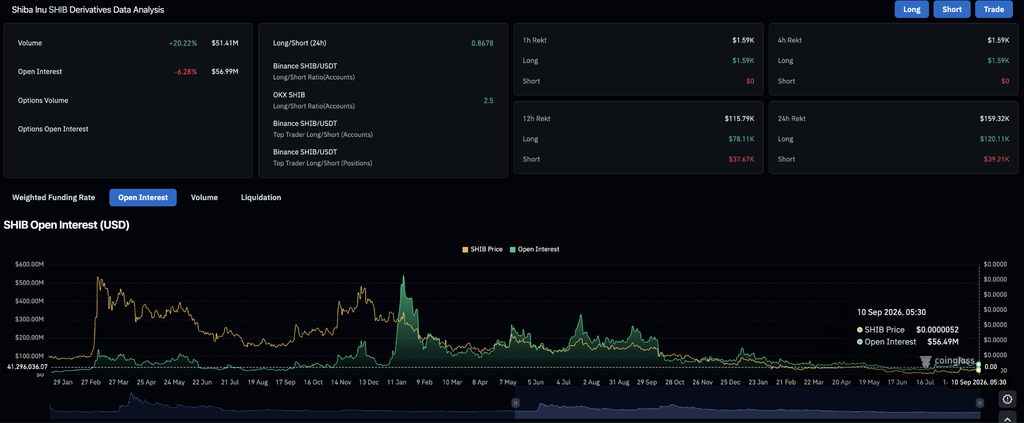
Traders who bought $SHIB’s recent bounce are the ones paying for today’s reversal. Longs took $120,110 of the $159,320 liquidated over the past 24 hours, and every single liquidation in the past hour and past four hours came from long positions, not one short got caught out. That’s a clean signature of a trend flip, not a two-sided shakeout.
The volume and open interest numbers point the same direction. Derivatives volume rose 20.22% to $51.41 million while open interest fell 6.28% to $56.99 million, more people trading, fewer positions left standing, the pattern you’d expect when longs are getting stopped out rather than new money coming in on either side. OKX’s accounts are the outlier here, still positioned long at a 2.5 ratio even as the broader market’s 24-hour long/short ratio sits at 0.8678 leaning short, a gap worth watching if OKX traders start capitulating too.
| Metric | Value | What it shows |
| Derivatives volume (24h) | $51.41M, up 20.22% | Trading activity picking up |
| Open interest | $56.99M, down 6.28% | Traders closing positions, not adding |
| 24h long liquidations | $120.11K of $159.32K total | Longs took the bulk of today’s losses |
| OKX long/short ratio | 2.5 | OKX traders staying heavily long despite the pullback |
Shiba Inu Price Prediction: Bullish and Bearish Scenarios for September 11
Bullish Case, Target: $0.00000567
$SHIB holds above $0.00000512 and reclaims $0.00000529. A close back above $0.00000536 would flip the Supertrend signal bullish again and open room toward the 200-day EMA and 0.618 Fib confluence at $0.00000567.
Bearish Case, Risk Level: $0.00000467 (0.236 Fib)
$SHIB loses $0.00000512 and the positive exchange netflow turns into actual selling. A break below the 0.382 Fib and EMA cluster near $0.00000505 exposes the 0.236 Fib support at $0.00000467 next.
FAQs
$SHIB could extend toward $0.00000567 if it reclaims $0.00000529. Losing $0.00000512 risks a pullback toward $0.00000467.
The recent burns have mostly been worth a few dollars each, which does nothing against a supply sitting in the hundreds of trillions. The 62% drop in burn rate everyone’s citing is a real number, it’s just a real number about something too small to matter.
Mixed. OKX accounts remain heavily long at a 2.5 ratio, but longs absorbed the bulk of today’s liquidations after the Supertrend indicator flipped bearish.