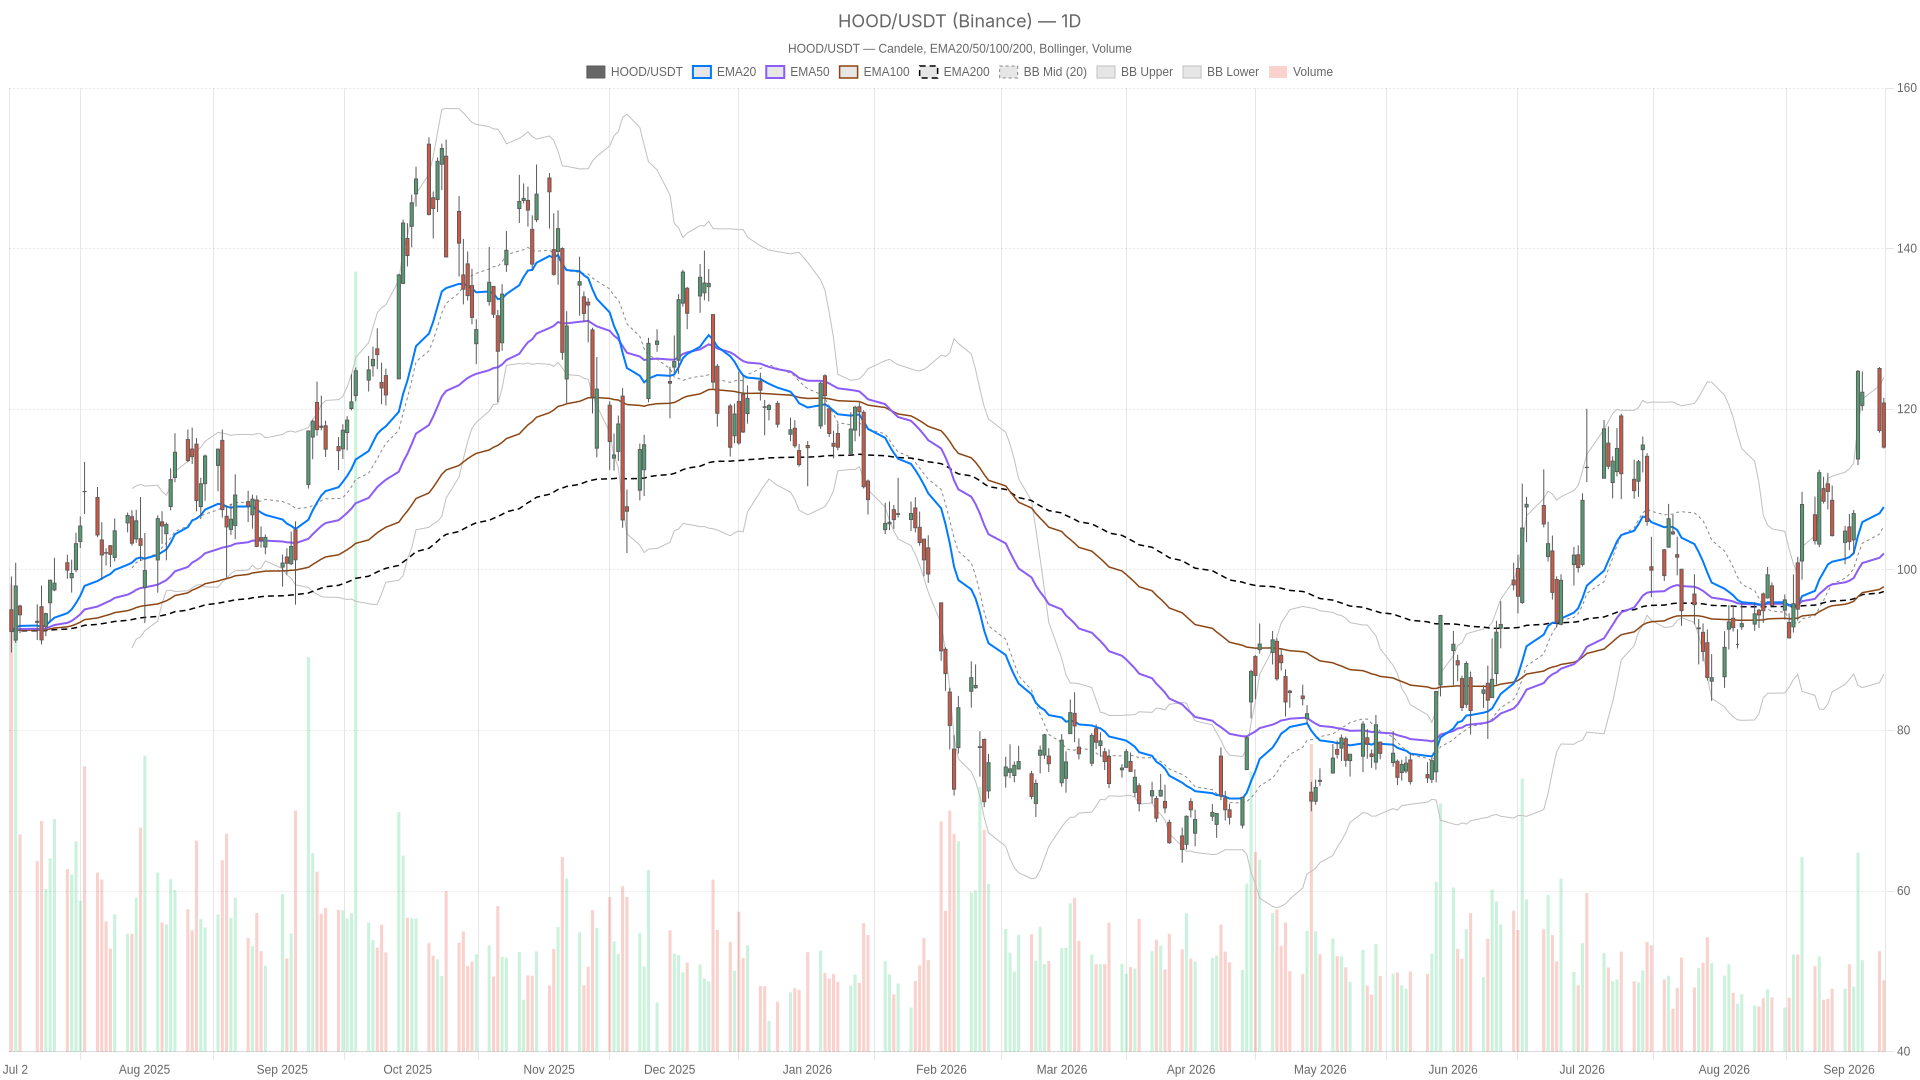
Daily Structure Still Favors Robinhood Stock
The daily timeframe confirms Robinhood stock remains in a textbook bullish structure. All three key moving averages are stacked in proper alignment, and the broader trend has not been broken by Tuesday’s pullback.
Moving Average Alignment Confirms Trend
On the daily timeframe, the technical picture remains constructive. Price sits comfortably above the EMA20 at 107.82, the EMA50 at 102.03, and the EMA200 at 97.30. That stacked alignment confirms the broader trend has survived Tuesday’s pullback intact. The daily regime reading is labeled bullish, reinforcing that the primary trend remains up despite the sharp intraday reversal.
Momentum and Volatility Indicators
Notably, momentum backs up that structure. The daily RSI14 stands at 58.63, comfortably in bullish territory but nowhere near overbought extremes. That leaves room for further upside without immediate mean-reversion risk. MACD tells a similar story, with the line at 5.18 sitting well above the signal at 3.64. The positive histogram of 1.55 confirms momentum is still pointed higher on this timeframe.
The Bollinger setup adds context. With the mid-band at 105.48 and the upper band at 123.94, Tuesday’s high of 121.42 pushed price close to the top before the reversal. That rejection near the upper band, combined with a daily ATR14 of 7.51, signals elevated volatility. A $7.51 average daily range is substantial, and traders should size positions accordingly.
At the same time, pivot levels reinforce the sense of a stretched move. The daily pivot sits at 117.26, with resistance R1 at 119.44 and support S1 at 113.11. HOOD closed below its own pivot point, meaning Tuesday’s session ended on the defensive side of the ledger.
HOOD 1H Momentum Complicates the Bullish Case
The hourly chart paints a less supportive picture. Weakening momentum now conflicts directly with the daily bullish signal, and price is straddling a critical decision zone.
Price closed at 115.29, sitting below the EMA20 at 117.96 but still above the EMA50 at 115.21. That is a mixed signal, straddling short-term resistance while holding just above key intraday support.
However, the hourly RSI14 at 41.36 confirms weakening momentum, sitting below the neutral 50 mark. Meanwhile, MACD on the 1H has flipped negative. The line at 0 versus a signal of 1.04 produces a histogram of -1.03. That bearish crossover directly conflicts with the daily MACD reading. In short, the bigger trend is still up, but near-term momentum has clearly rolled over.
The hourly Bollinger Bands add to that picture. Price at 115.29 trades close to the lower band at 114.19, far from the mid-band at 119.87. That proximity to the lower band, combined with a neutral hourly regime reading, suggests a corrective phase rather than a fresh downtrend. The hourly pivot at 115.70, with support at 114.68, sits right where price is trading. This makes the current area a genuine decision zone.
15m Execution: Oversold, But Not Yet Turning
The 15-minute chart signals short-term selling exhaustion, though a bullish reversal has not yet been confirmed. Price is squeezed between resistance and a longer moving average acting as a floor.
On the 15-minute chart, RSI14 has dropped to 32.73. That level typically flags short-term exhaustion on the sell side. MACD shows the line at -0.74 against a signal of -0.78, leaving a thin histogram of just 0.04. That near-flat reading hints that momentum may be stabilizing, even if it has not yet turned bullish.
Price is trading below both the EMA20 at 116.76 and EMA50 at 118.08. However, it remains above the EMA200 at 115.34. That keeps the very short-term structure fragile. The 15m pivot at 115.55 frames the immediate battle zone for intraday traders watching Robinhood stock right now. Support sits at 114.83 and resistance at 116.01.
Robinhood Stock: Conflicting Signals, Not a Trend Reversal
HOOD is experiencing a sharp pullback inside a still-intact bullish structure, not a trend reversal.
Overall, the conflict across timeframes is clear. The daily chart says uptrend. The hourly chart says correction. The 15-minute chart says oversold but not yet reversing. Therefore, the most coherent interpretation is a sharp pullback inside a still-intact bullish structure.
This kind of conflict is not unusual after a strong run. Notably, the daily EMA200 at 97.30 remains far below current price. That means the broader trend has plenty of room before it would be technically threatened. In contrast, the hourly and 15-minute charts are simply digesting Tuesday’s reversal from the highs.
What Would Support the Bullish Scenario
Bulls need to defend the daily S1 at 113.11 and reclaim the daily pivot at 117.26 to put recent highs back in play. Holding above those levels would signal the correction is stabilizing.
For bulls, holding above the daily S1 at 113.11 and the hourly EMA50 at 115.21 would be an encouraging sign. A recovery back above the daily pivot at 117.26 would strengthen the case. A subsequent push through R1 at 119.44 would put the recent highs near the upper Bollinger Band at 123.94 back in play.
Analyst sentiment currently leans supportive. StoneX has set a bullish price target implying roughly 47.5% upside. Goldman Sachs and Jefferies have both reset their targets on the stock. Robinhood also presented at the Goldman Sachs Communacopia + Technology Conference this week, keeping the name in the spotlight. Meanwhile, Robinhood stock held steady even as peers SoFi and Affirm both declined. That relative strength is worth noting.
What Would Invalidate the Bullish Case
A decisive break below the daily S1 at 113.11 would change the tone and put the daily bullish regime under genuine pressure for the first time in this move.
On the other hand, a decisive break below the daily S1 at 113.11 would change the tone. If that level fails and selling accelerates, the next real reference point becomes the daily EMA50 at 102.03. A sustained move of the hourly RSI below 40 would raise concerns. If paired with a widening negative MACD histogram, it would confirm that the correction is deepening rather than stabilizing. In that scenario, the daily bullish regime would come under genuine pressure for the first time in this move.
Closing Take
Robinhood stock sits in a tug-of-war between a strong daily trend and a shaky short-term tape. Elevated volatility argues for patience rather than aggressive positioning.
At this stage, Robinhood stock sits in a classic tug-of-war between a strong daily trend and a shaky short-term tape. Volatility is elevated, as the daily ATR14 of 7.51 makes clear. That alone argues for caution on position sizing. Therefore, traders should treat the current zone as the key battleground. This zone spans roughly from hourly support at 114.68 to the daily pivot at 117.26. Until price resolves cleanly on one side of that range, uncertainty remains the dominant theme. Patience is likely the more disciplined approach.
FAQ
What is the current trend for Robinhood stock?
The daily chart shows a clear uptrend with EMA20, EMA50, and EMA200 stacked in bullish alignment. However, intraday charts signal that a short-term correction is underway, with the hourly MACD having flipped bearish.
What are the key levels to watch for HOOD?
Bulls need to defend daily S1 at $113.11 and hourly EMA50 at $115.21. A recovery above the daily pivot at $117.26 would strengthen the bullish case. A break below S1 would shift focus to the daily EMA50 at $102.03.
Is Robinhood stock overbought right now?
No. The daily RSI14 at 58.63 sits comfortably in bullish territory, well below overbought extremes. This leaves room for further upside without immediate mean-reversion risk.
What is the analyst outlook for HOOD?
Analyst sentiment leans supportive. StoneX has set a bullish target implying roughly 47.5% upside. Goldman Sachs and Jefferies have also reset their targets on the stock following the Goldman Sachs Communacopia + Technology Conference.
Disclaimer: This article is for informational purposes only and does not constitute financial advice, an investment recommendation, or a solicitation to buy or sell any financial instrument or cryptocurrency. The analysis provided is not indicative of future results. Investing in crypto assets and financial markets carries a high risk of capital loss. Always do your own research (DYOR) and consult a qualified financial advisor before making any decision.
Article produced with the assistance of artificial intelligence and reviewed by the editorial team.

 en.cryptonomist.ch