
 coinedition.com
$XRP traders face a potentially important week as markets prepare for the CLARITY Act vote. The legislation has become a major focus across the $XRP community. Traders also await the Federal Open Market Committee meeting and fresh U.S. inflation data. These events could influence risk appetite across crypto markets.
Meanwhile, $XRP continues to consolidate near $1.44 after recovering from earlier weakness. Technical indicators still favor a cautiously bullish outlook, but derivatives data shows reduced conviction.
$XRP Holds Above Key Technical Levels
$XRP currently trades near $1.44 and remains above its major daily moving averages. The 20-day EMA stands at $1.3647, while the 50-day EMA sits at $1.2659. $XRP also remains above its 200-day EMA near $1.3553.
This positioning keeps the broader technical structure constructive. However, $XRP faces immediate resistance between $1.45 and $1.50. A daily close above that zone could strengthen the bullish setup.
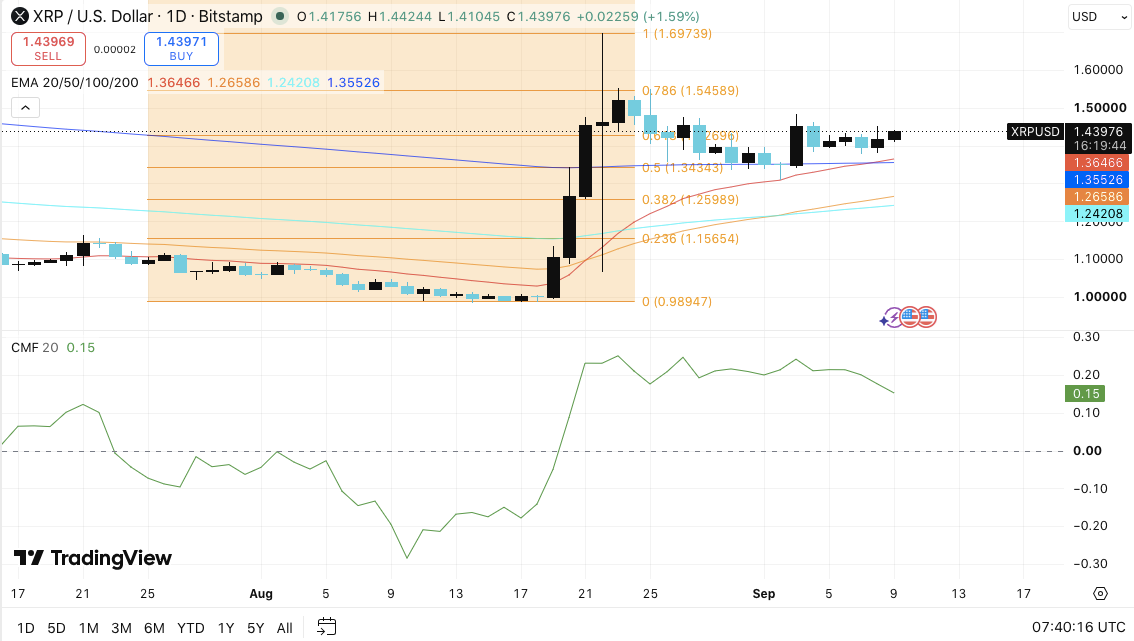
Significantly, the $1.5459 level marks the 0.786 Fibonacci resistance. A sustained move above that barrier could open the path toward $1.60-$1.70.
On the downside, $XRP needs to defend $1.40-$1.41 initially. Losing the $1.355-$1.343 region could undermine the current bullish structure.
Related: Ethereum Price Prediction: Can ETH Clear $2,600 as Institutional Buying Continues?
Additionally, the Chaikin Money Flow indicator remains positive near +0.15. However, its recent decline suggests that buying pressure has started to cool.
Derivatives Data Shows Caution
$XRP’s open interest tells a more cautious story than its price structure. Open interest surged above $10 billion during the July rally. That increase showed heavy speculative activity and greater leverage.
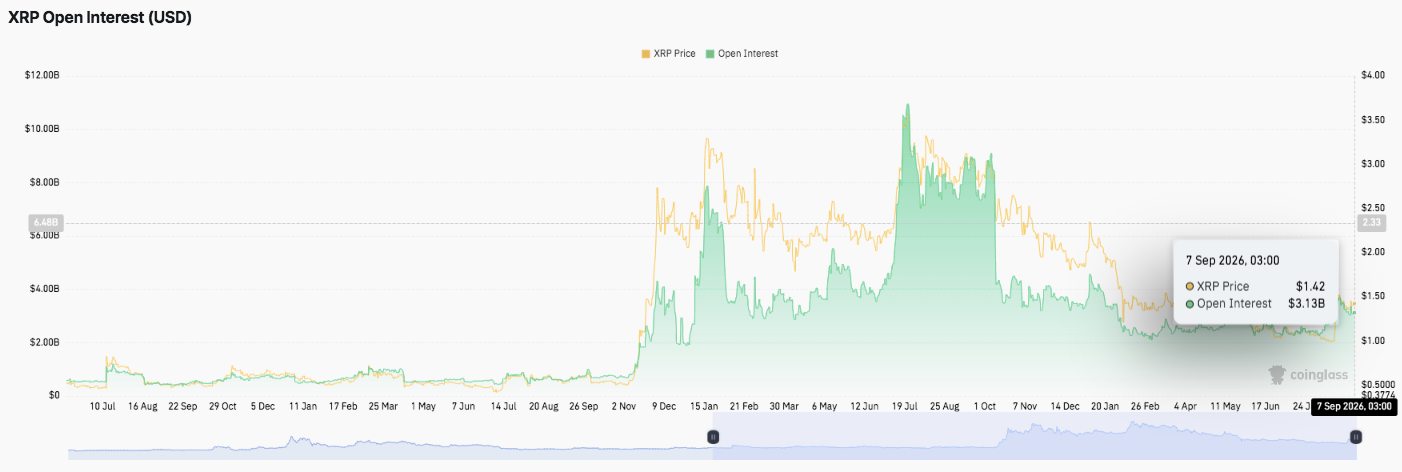
However, open interest declined sharply as $XRP weakened. The latest reading stood near $3.13 billion on September 7. That represents a substantial reduction from the earlier peak.
Consequently, traders appear less willing to maintain large leveraged positions. Falling open interest can reduce liquidation risks, but it can also signal weaker market conviction.
$XRP’s spot flows offer a slightly more encouraging signal. Outflows dominated much of the earlier period, particularly between November and February. However, flows became more balanced from March onward.
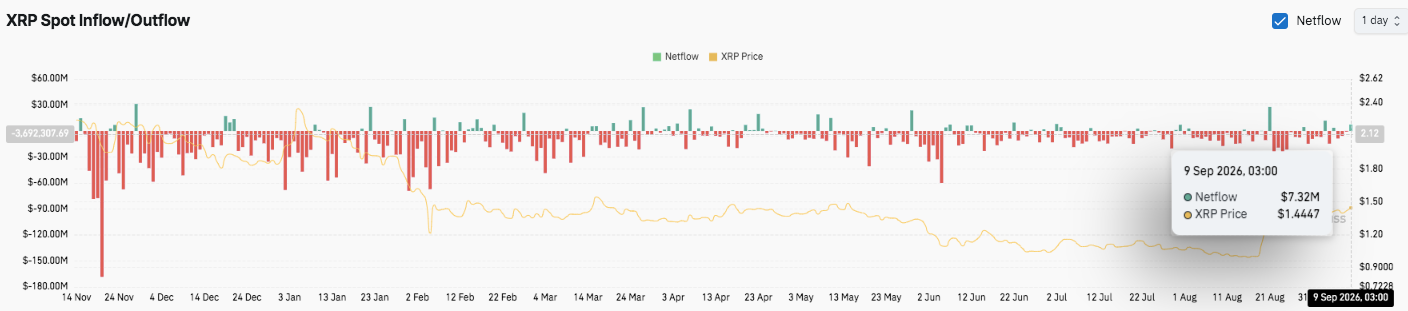
By September 9, $XRP recorded a $7.32 million net inflow. This shift suggests that buyers may have started returning to the market. Hence, improving spot flows could provide support if bullish momentum returns.
CLARITY Act Becomes a Major Catalyst
The CLARITY Act has emerged as a major talking point among $XRP supporters ahead of September 15. Many community members view the legislation as potentially important for $XRP’s regulatory position.
The discussion has gained traction across X and Reddit. $XRP-focused commentator RippleXity recently highlighted the potential significance of the legislation for $XRP.
🚨 JUST IN: The CLARITY Act will strengthen $XRP’s path into mainstream U.S. finance. 🇺🇸
— RippleXity (@RippleXity) September 8, 2026
Here’s why $XRP holders should pay attention:
➜ Clearer rules for market participants. The proposed framework defines SEC and CFTC responsibilities across digital asset markets. Senate… https://t.co/VPq6IbU93A pic.twitter.com/pd4SFwbAK7
Besides the legislative vote, traders must monitor the FOMC meeting and upcoming CPI data. These events could influence dollar strength, Treasury yields, and broader risk appetite.
Related: Cardano Price Prediction: Can ADA Break Its Range Before This Week’s CPI Report?
Moreover, crypto markets could react sharply if economic data changes expectations for monetary policy. $XRP therefore faces several catalysts at the same time.
Technical Outlook for $XRP Price
Key levels remain well-defined heading into the next trading phase:
Upside levels: $1.45, $1.50, and $1.5459 as immediate hurdles. A breakout above $1.5459 could extend the rally toward $1.60 and $1.70.
Downside levels: $1.40–$1.41 provides immediate support, followed by $1.3647 and $1.3553. A deeper correction could expose $1.3434 and $1.2599.
Resistance ceiling: $1.50 is the first major barrier, while $1.5459 represents the key Fibonacci resistance. Flipping these levels could strengthen medium-term bullish momentum.
The technical picture suggests $XRP is consolidating above its major EMAs while testing a critical resistance zone. Positive CMF indicates continued capital inflows, although weakening momentum signals some caution.
Will $XRP Go Up?
$XRP’s near-term direction hinges on whether buyers can defend the $1.40–$1.41 support zone and challenge $1.50. A decisive breakout could push $XRP toward $1.5459, followed by $1.60 and potentially $1.70.
However, failure to hold $1.40 could send $XRP toward the 20-day EMA at $1.3647. A break below the $1.355–$1.343 support cluster would weaken the bullish structure.
Related: VeChain Price Prediction September 2026: VET Breaks a Multi-Year Downtrend
For now, $XRP remains in a pivotal zone. A breakout above $1.50 could confirm renewed bullish momentum, while a loss of $1.35 would shift the outlook toward caution.