Why is Hyperliquid price still rising after an $820 million token unlock?
invezz.com
09 September 2026 13:29, UTC
Hyperliquid's price has risen roughly 2% over the past 24 hours to $86.05 on September 9, recovering from an intraday low near $81.82 and moving back towards its record high near $89.
According to Hyperliquid market data, open interest across the platform has reached a record $14.3 billion after increasing by roughly $3.57 billion over the past month.
Much of the recent activity has been supported by Hyperliquid's core crypto perpetual markets, while open interest in markets deployed through HIP-3 has declined.
Know when your coins move
Alerts, real-time prices, and market news — all in one app
4.8 based on 40K reviews in the App Store and Google Play
Roughly 97% of fees generated by the core perpetual market are routed towards $HYPE buybacks, while builders using HIP-3 can retain up to half of the fees generated by markets they deploy.
The increase in core perpetual open interest has coincided with continued purchases of $HYPE.
Hyperliquid repurchased and burned 15,350 $HYPE worth roughly $1.32 million during the latest 24-hour period, with the tokens bought at an average price of $86.17.
Cumulative burns have reached roughly 48.45 million $HYPE, equivalent to 4.84% of the token's maximum supply.
The buyback mechanism gives protocol trading activity a direct route into recurring purchases of the token.
As a result, $HYPE has continued trading near record levels despite a large scheduled token unlock earlier this month.
Roughly 9.92 million $HYPE, valued at nearly $820 million at the time, was scheduled to unlock on September 6.
The event had raised concerns that more tokens could reach the market, but $HYPE subsequently climbed towards $89.
Historical unlock data had shown that only a small portion of previously unlocked $HYPE was transferred to exchanges, limiting immediate selling from those distributions.
Meanwhile, trading access has also expanded as Hyperliquid attracts users from Base.
Coinbase began directing Base App users towards Hyperliquid in mid-August, giving users another route into the protocol's perpetual markets.
Hyperliquid's potential entry into the regulated US derivatives market has remained part of the token's recent price narrative.
The protocol has explored ways for US companies to offer perpetual contracts that trade and settle on Hyperliquid, including discussions around regulatory guidance and no-action relief from the Commodity Futures Trading Commission and Securities and Exchange Commission.
$HYPE's latest recovery has occurred while Bitcoin has traded below $80,000.
The token dropped to roughly $81.82 during the session before recovering above $86, leaving it only a few percentage points below the record high set earlier this week.
$HYPE price analysis
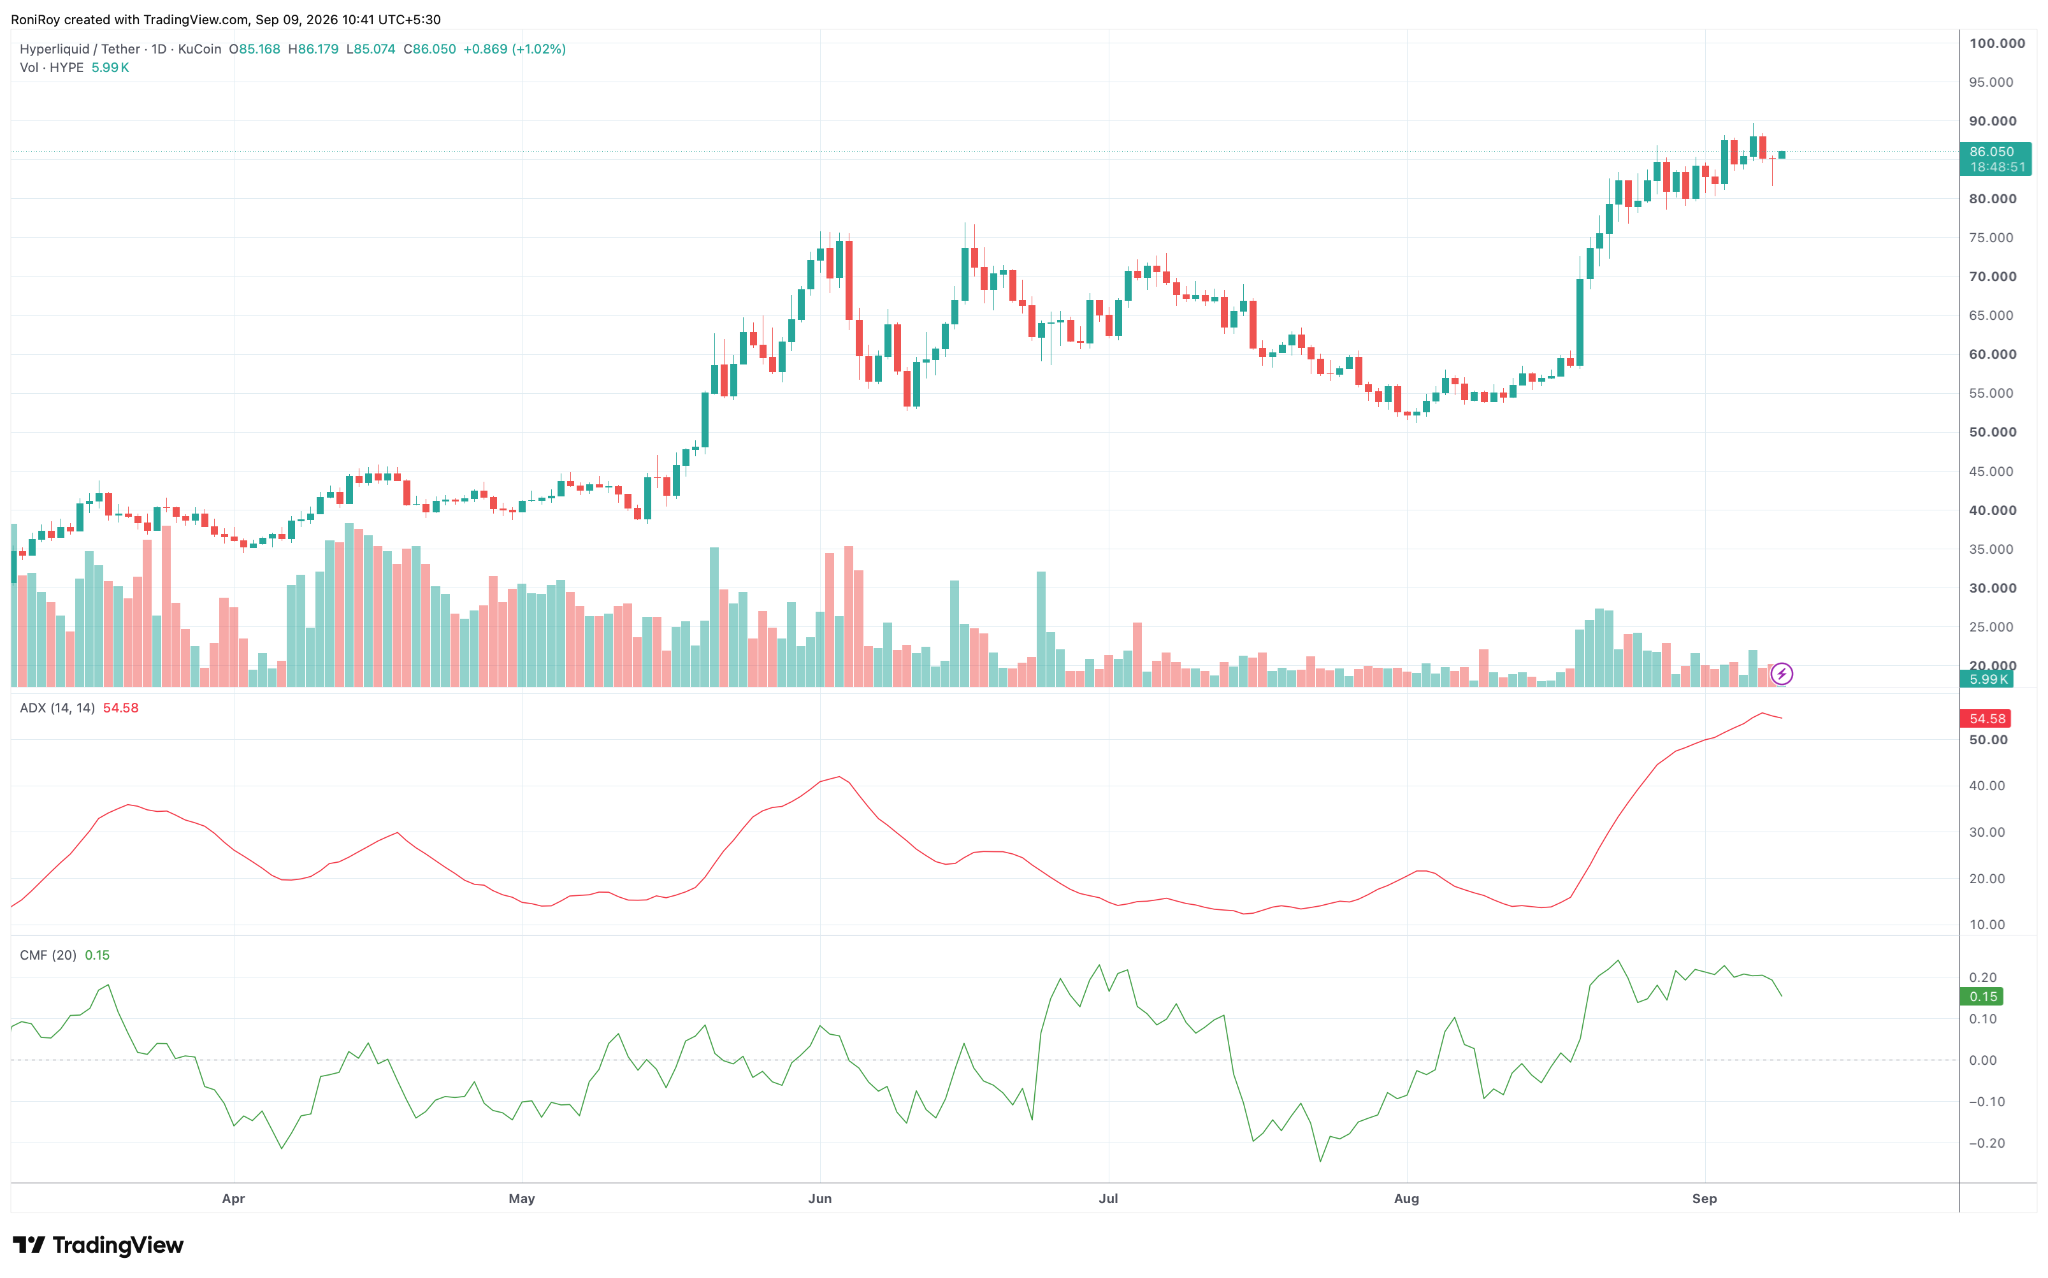
$HYPE's daily chart shows price holding around $86 after climbing from a close to $52 in early August.
The move accelerated in the second half of August, taking the token through its previous June peak around $75 before reaching the $89 area.
$HYPE’s Average Directional Index has climbed to 54.58 on the daily chart.
ADX measures trend strength without determining direction, and a reading above 50 indicates that the current trend has become strong.
In $HYPE's case, the rise in ADX has accompanied the move from the $50s into the $80s, while price continues to trade close to its recent high.
Chaikin Money Flow remains positive at 0.15. CMF moved above zero during the August breakout and reached above 0.20 before easing to its current level.
Price has remained near $86 while CMF stays positive, showing that buying pressure has not reversed into net selling despite the pullback from $89.
The immediate resistance zone sits between $88 and $90, where $HYPE has repeatedly stalled during the past several sessions.
A daily close above $90 would leave little visible historical resistance above the token and could open a move towards $95, followed by the psychological $100 level.
Failure to break $90 could keep $HYPE trading inside its recent range.
The first important support sits around $82 to $83, close to the September 9 intraday low and the lower end of the recent consolidation.
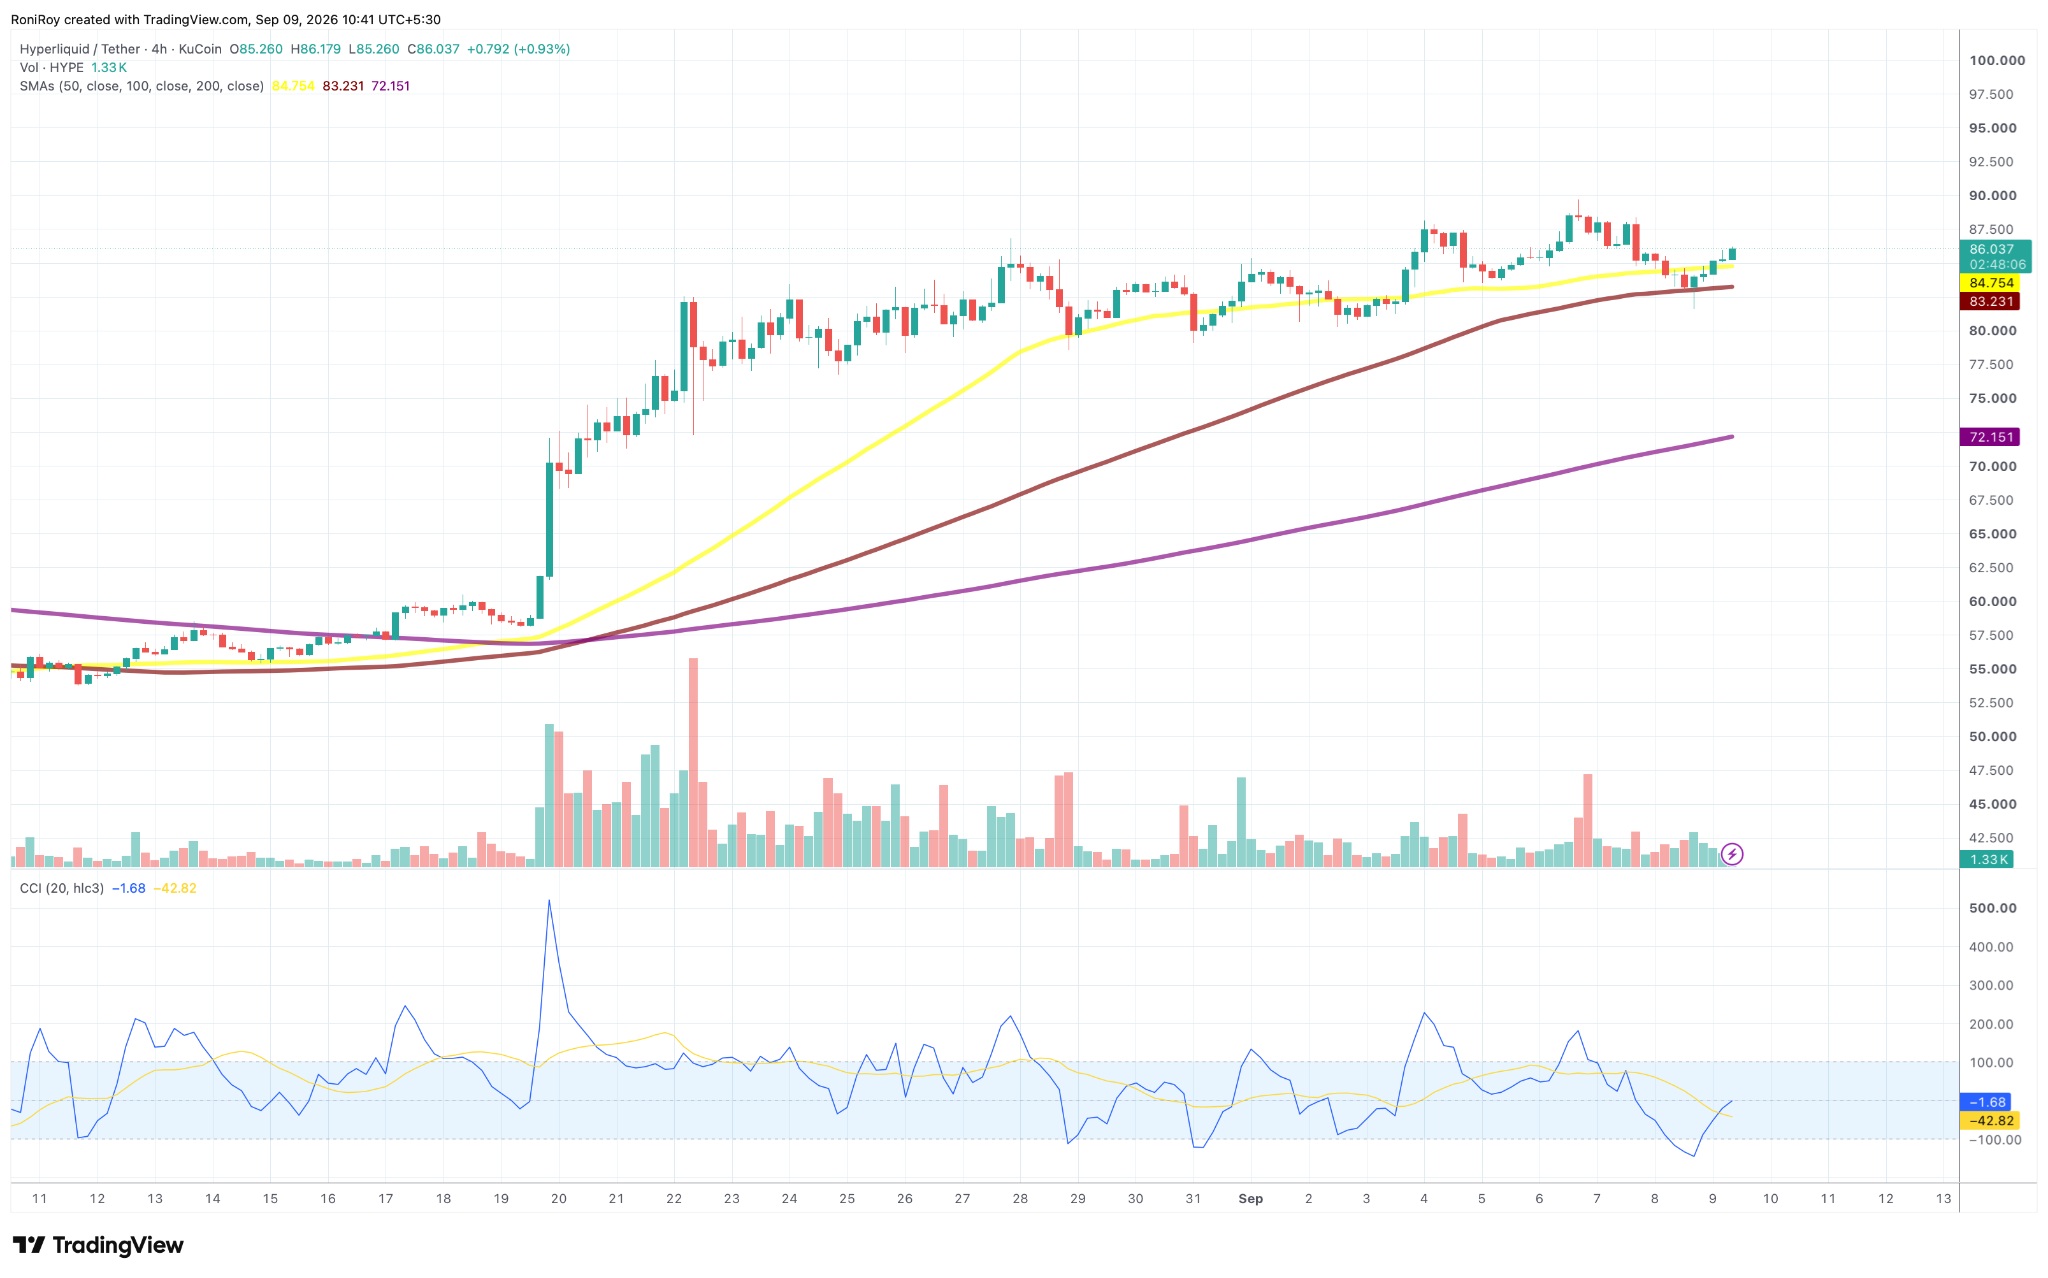
On the 4-hour chart, $HYPE has recovered above its 50-period simple moving average at $84.75 after briefly trading below it.
The 100-period SMA sits at $83.23, placing two moving-average supports within roughly $3 of the current price.
The 200-period SMA at $72.15 remains well below both shorter averages. The 50 SMA is above the 100 SMA, while both remain above the 200 SMA, preserving the bullish ordering that developed during $HYPE's August run.
Commodity Channel Index has recovered to -1.68 after falling below -100 during the September 8 pullback.
The indicator has moved back above its smoothed reading near -42.82, matching the price recovery from the low-$80s towards $86.
A move through $89-$90 with CCI returning firmly into positive territory would support an attempt at $95 and then $100.
At the current price of roughly $86, reaching $100 would require an increase of roughly 16%.
If $HYPE loses the 50-period SMA at $84.75, the 100-period SMA around $83.23 becomes the next support to watch.
A 4-hour close below $83 would expose the recent low near $81.82, while a break below that level could bring $78-$80 back into play.

 invezz.com