
 coinpaper.com

Solana traded around $105 on the supplied four-hour chart Tuesday, Sept. 8, keeping $SOL above the psychologically important $100 level after a volatile start to September. CoinGecko data showed a Sept. 7 close of $103.77, while two technical charts now outline a near-term breakout test around $115-$116 and a much more ambitious long-term recovery structure.
The bullish setups remain conditional. One chart warns that a rally toward $116 could be followed by a sharp reversal, while the longer-term outlook requires Solana to clear several major resistance zones before targets near $250 or higher become technically relevant.
$SOL Compresses Near $105 as $115-$116 Breakout Test Approaches
Solana is pressing into a tightening four-hour structure after recovering from its early-September lows, with rising support meeting a descending resistance line near the current price. Trader SatoshiOwl sees that compression resolving higher first, potentially sending $SOL toward $115-$116.
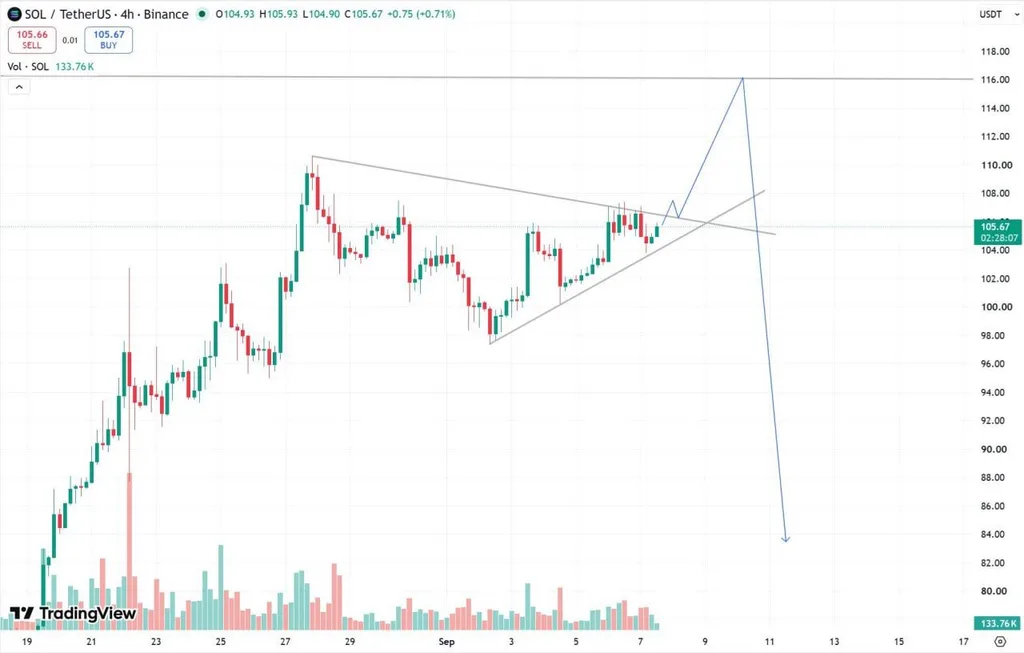
Solana $SOL $115-$116 Breakout Setup. Source: SatoshiOwl (@SatoshiOwl) on X
The chart shows $SOL near $105.67, close to the point where the two converging trendlines meet. The descending line traces back toward the late-August high around $110, while the rising trendline connects the rebound from roughly $97-$98.
A break above the upper trendline would be the first bullish confirmation. Solana would then need to clear the recent $107-$108 area before the chart’s projected move toward $115-$116 becomes more credible.
That target also represents the main risk in SatoshiOwl’s scenario. The projected path shows a final push toward approximately $116 followed by a steep reversal toward the mid-$80s. The trader described the outlook as bullish in the short term but much more cautious if optimism becomes excessive near $116.
A move back below the rising support line and recent lows around $103-$104 would weaken the immediate breakout setup. Losing $100 would further undermine the bullish structure.
Longer-Term $SOL Chart Maps $148 and $248 Before $1,000 Scenario
A separate long-term chart from Celal Kucuker presents a significantly more bullish scenario, built around Solana’s recovery from a major support region near $70.72. The chart sketches a rounded recovery structure that could eventually challenge much higher resistance if $SOL continues rebuilding momentum.
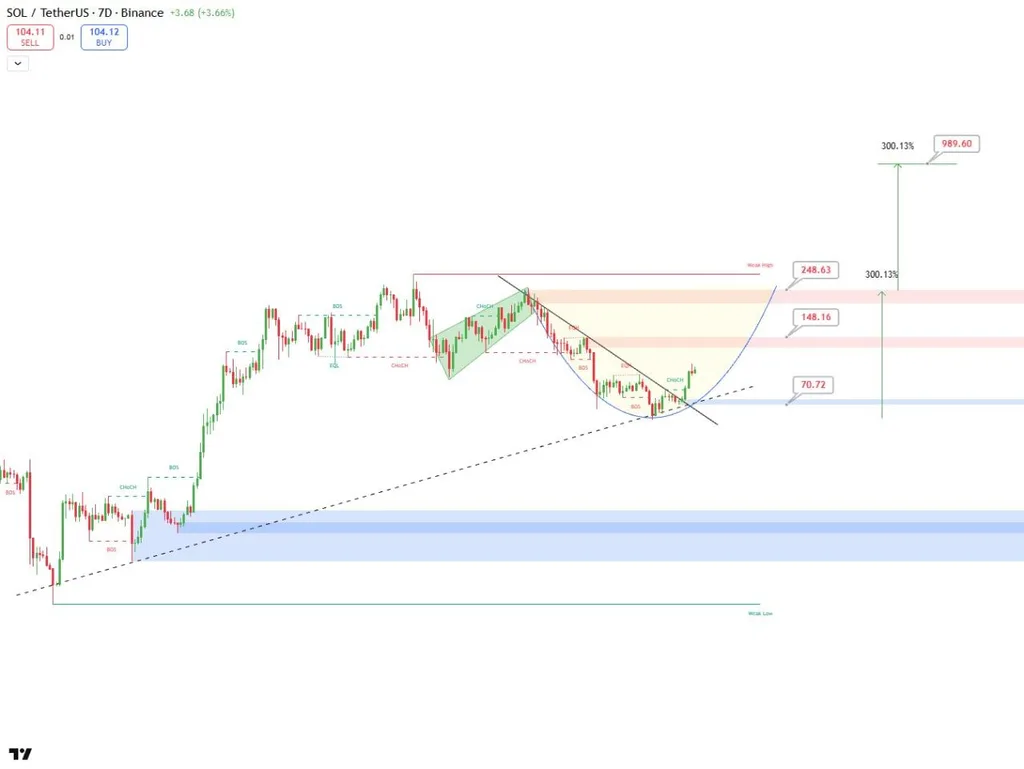
Solana $SOL Long-Term $148-$248 Recovery Targets. Source: Celal Kucuker (@CelalKucuker) on X
The seven-day Binance chart identifies $70.72 as the major support area underpinning the bullish thesis. Price has rebounded from that region and appears to be moving away from a descending trendline, but several important barriers remain overhead.
The first major level shown is $148.16. A sustained move above that area would improve the longer-term structure and put the larger resistance zone near $248.63 into focus.
Kucuker said he expects $SOL to reach $300 and make a new all-time high, with $1,000 possible if the formation fully develops. The chart itself illustrates an extended measured-move scenario toward roughly $989.60, but that outcome depends on $SOL first clearing the much nearer $148 and $248 resistance levels.
For now, the two charts point to very different time horizons. The immediate battle is around $107-$108 and then $115-$116, while the larger bullish case requires Solana to establish a sustained breakout before the more aggressive long-term targets become relevant.