
 thecryptobasic.com

$XRP has pulled back from the $1.69 high reached during its August rally, but its 4-hour chart still shows a bullish Break of Structure (BoS).
Notably, $XRP rose 71.8% from $0.988 to $1.698 in August before the current pullback began. The decline has already erased about 20% of the August high, as the price now trades just above the EMA21 at $1.4020.
This level could help determine whether the pullback stays limited or turns into a steeper decline.
$XRP Maintains Bullish BoS
The 4-hour chart shows that $XRP formed a bullish BoS 23 bars ago after breaking above $1.4335. This move gave buyers control of the short-term trend, but the recent decline has brought the price back to the EMA21 at $1.4020. The EMA55 at $1.3884 now provides another support level below the EMA21.
Meanwhile, $XRP’s Bollinger Bands range from $1.3607 to $1.4433. $XRP currently sits in the lower half of this range, but this alone does not point to a reversal. Instead, the price action could simply undergo a period of consolidation within the wider 4-hour uptrend.
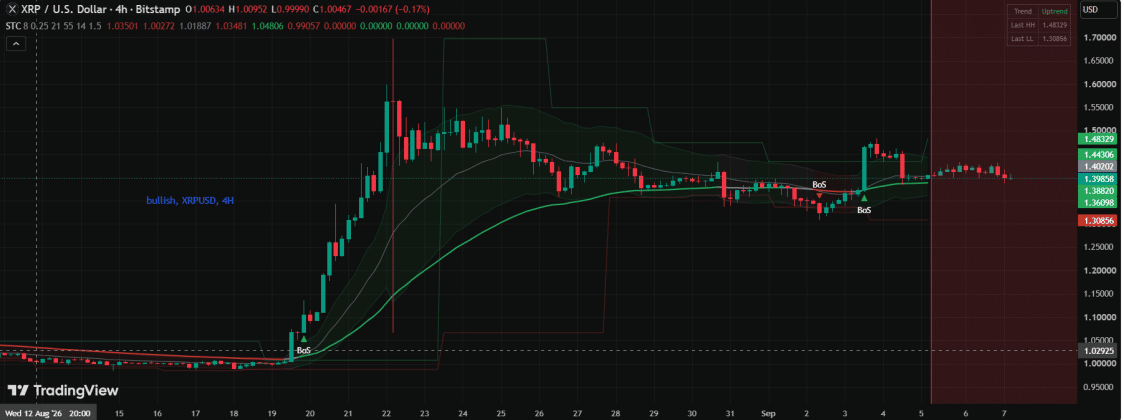
The chart leaves the $1.4835 swing high as the next major level to watch. $XRP has not tested this level since forming the bullish BoS. As a result, a move toward it would give buyers a chance to complete the next major test in the current structure.
Important $XRP Demand Zone
The area around the EMA21 at $1.4020 and the $1.4335 BoS level features an important support zone for the current structure.
Below it, the $1.35–$1.38 region could provide further support. Market analyst Ali Martinez previously identified this area as a major demand zone, with about 3.2 billion $XRP changing hands there.
If $XRP loses the EMA21, the price could first move toward the EMA55 at $1.3884. Further weakness could then bring the $1.35-$1.38 demand zone into focus. However, a move back above $1.4335 would strengthen the bullish setup and increase the chances of a retest of $1.4835.
$XRP ETFs Keep Drawing Fresh Capital
$XRP’s price has declined from its August high, but spot $XRP ETFs have continued to attract capital. US spot $XRP ETFs recorded $110.49 million in inflows during the week ending Aug. 28, marking their strongest weekly inflow of 2026.
The funds extended their inflow streak to 11 straight trading sessions, bringing in roughly $170 million during that period. The continued inflows as $XRP declined suggest that investors are still adding exposure as the market works through its recent correction.
Despite Goldman Sachs confirming about $87.4 million in $XRP ETF exposure as of the second quarter, retail investors still account for nearly 84% of $XRP ETF inflows, which leaves room for greater institutional participation.
$XRP Needs to Reclaim $1.4335
Essentially, the bullish setup needs $XRP to close a 4-hour candle above $1.4335. Such a move would show that buyers have reclaimed the BoS level and could clear the path toward the $1.4835 swing high.
If $XRP breaks above $1.4835, the next major target would be the $1.6999 August high. However, the structure also has a clear level that would weaken the bullish case.
A 4-hour close below the EMA55 at $1.3884 would put the current structure under pressure and could indicate that the bullish setup has failed.