
 thenewscrypto.com

- $PUMP is currently hovering around the $0.0041 mark.
- There’s a bullish attempt to counter a macro downtrend.
As the first week of September closes, Pump.fun ($PUMP) is trading at $0.004195. Buyers have stepped in and defended the $0.0040 zone twice, printing a double bottom and showing that the sellers can’t push through that floor with any conviction.
The neckline likely sits at $0.00455. A clean breakout above that level with volume behind it confirms the double bottom and opens the door toward the projected target at around $0.0052, a crucial move from current levels. Until that breakout is confirmed, the bulls are in a waiting game.
In the early hours, the asset traded at a bottom of $0.004096. With a shift in momentum, it tested and broke multiple price ranges and gradually drove the $PUMP price to a high level of $0.004405. Besides, the 24-hour volume has potentially reached the $147.17 million zone.
Near-Term Price Levels to Watch for $PUMP
With the negative outlook, the recent trading pattern might slip even deeper and test the key support at the $0.004139 range. Further correction on the downside could likely trigger the emergence of the death cross in the $PUMP market, and the bears would send the price below $0.0040.
On the upside, if the bulls re-entered the market, the asset’s price could instantly rise to its nearest resistance level at $0.004251. Extended bullish pressure might push for the formation of the golden cross. Eventually, it could drive the $PUMP price even higher, above the $0.0043 mark.
Where Will $PUMP Take its Current Momentum?
The Moving Average Convergence Divergence line is slightly above the signal line, while both lines remain below the zero line; it is an early sign of bullish momentum forming within a broader downward trend. The overall background of the $PUMP market is still bearish.
Short-term price moving averages are lower than long-term averages, confirming sustained selling pressure. MACD crossing one point above it forms a fresh bullish crossover, showing that buyers are stepping in and driving price up faster than the immediate recent average. This represents a bullish attempt to counter a macro downtrend.
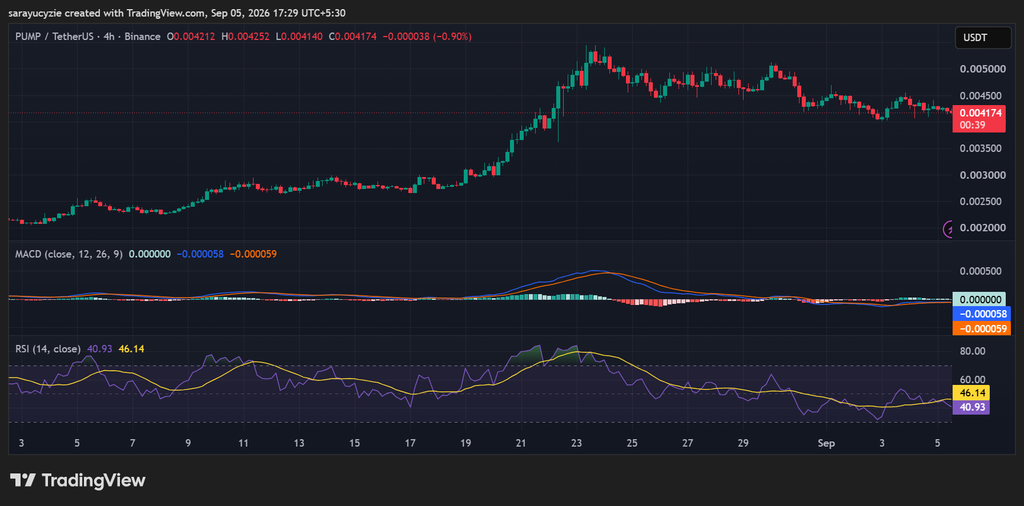
Moreover, the daily Relative Strength Index reading positioned at 40.93 hints at weak or neutral-bearish territory. The sellers currently hold a slight edge over buyers, with average price losses outperforming average gains over the recent lookback period.
The asset still has room to fall further before becoming overextended to the downside. A drop toward 40 signals a healthy pullback before the broader trend resumes. If the broader market is already bearish, an RSI staying in the 40–30 range confirms sustained selling pressure without enough buying momentum to reverse direction.