
 en.cryptonomist.ch

As of September 4, 2026, Cardano price today holds at $0.22, balanced on its daily pivot as two competing stories unfold. The daily chart stays neutral while the hourly timeframe tilts bullish — a tension that defines $ADA’s current setup and keeps traders watching for the next decisive move.
Key takeaways
- $ADA trades at $0.22, parked precisely on its daily pivot point as of September 4, 2026
- Daily RSI14 at 63.05 signals bullish momentum without approaching overbought territory
- The hourly EMA stack shows a clean bullish alignment across all three moving averages
- Cardano DEX fees surged broadly, with WingRiders spiking over 1,200% in a single day
- Daily ATR near 9% of spot price warns that rapid moves can strike in either direction
Daily Structure: Neutral, But Not Directionless
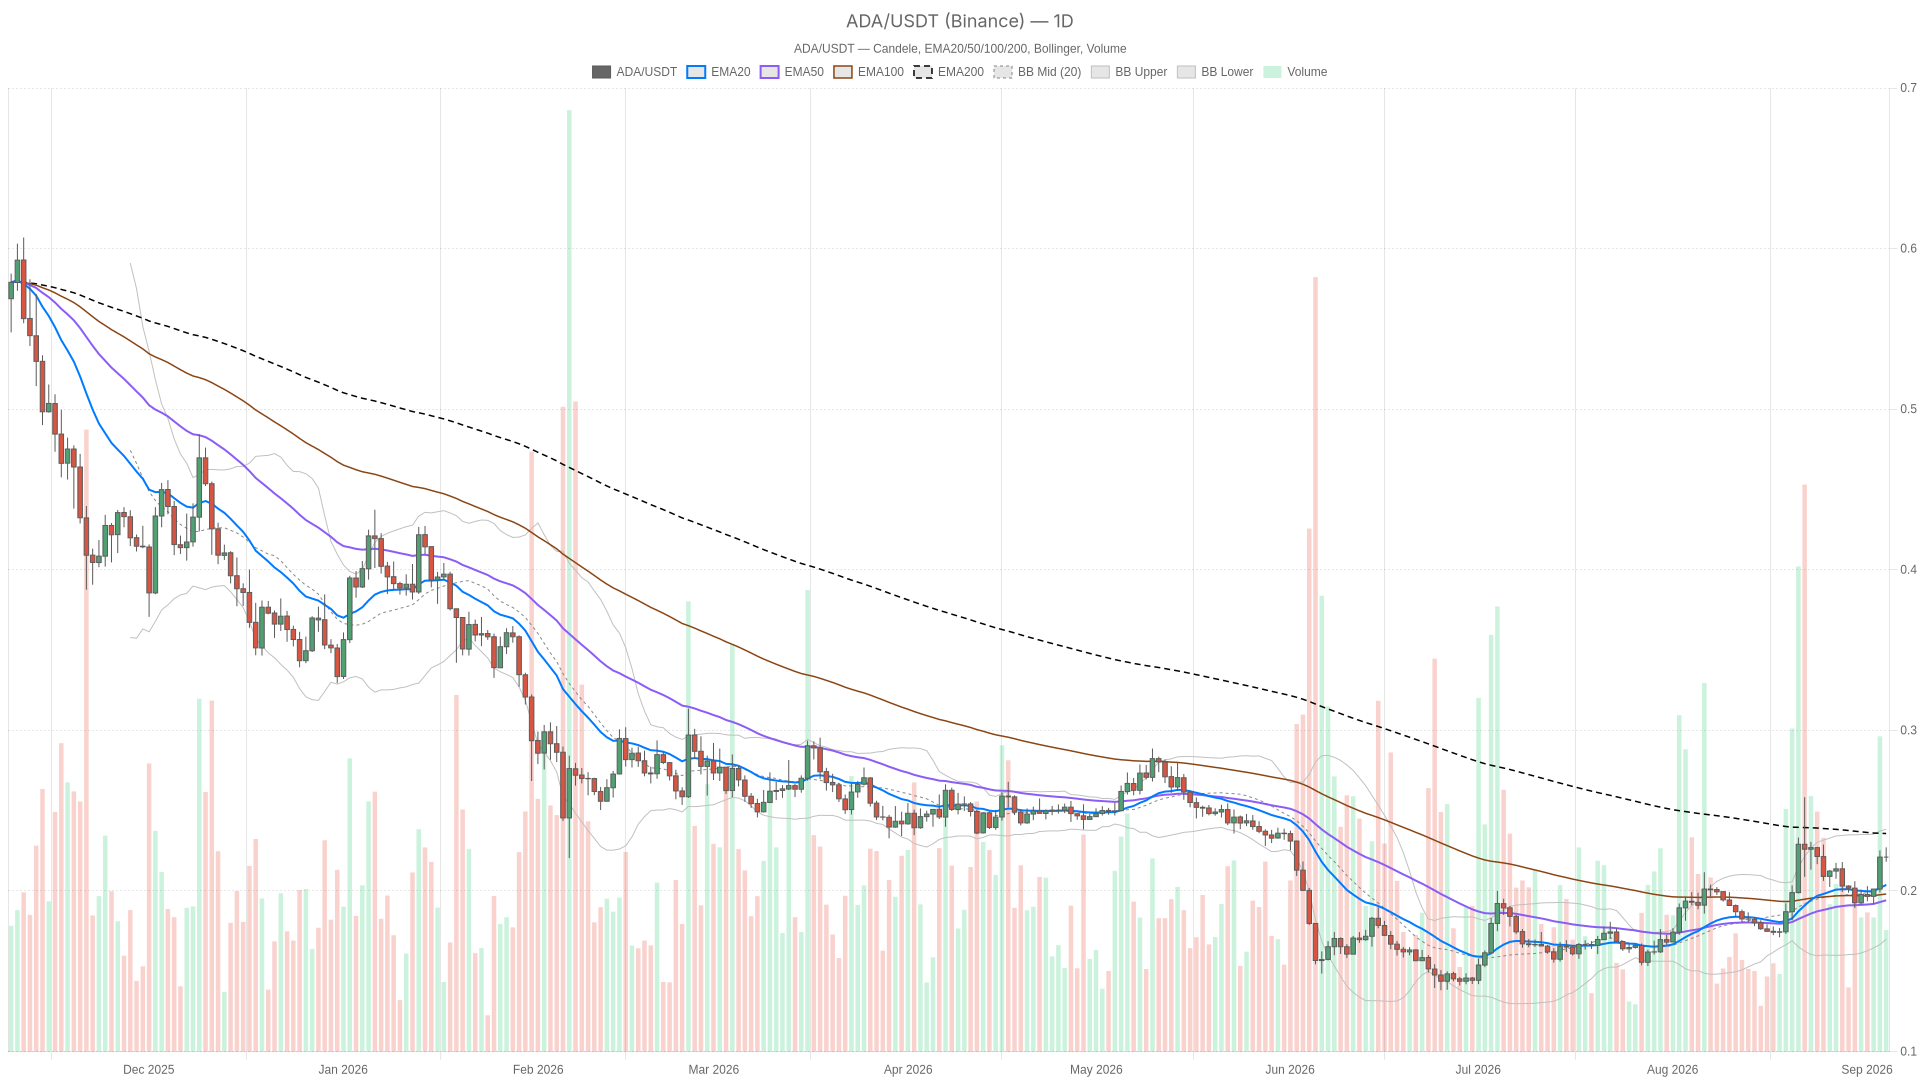
$ADA’s daily chart is neutral because price sits above the EMA20 and EMA50 yet remains below the EMA200 at $0.24. Short-term buyers have regained ground, but the longer-term trendline above still caps any sustained rally. Until $ADA closes convincingly above that $0.24 zone, this remains a recovery attempt inside a broader range rather than a confirmed reversal.
RSI14 on the daily sits at 63.05, firmly on the bullish side of neutral without touching overbought levels. That leaves room for further upside before the indicator itself becomes a headwind. The MACD, however, is essentially flat: line and signal both hover at 0.01 with a histogram reading of zero. That describes a market where momentum has stalled at the point of a potential crossover — not yet bearish, but not flashing a green light either.
The Bollinger Bands reinforce the Cardano price today picture: mid-band at $0.20, upper band at $0.24, lower band at $0.17. Price trading above the midline but below the upper band suggests $ADA has room to expand toward $0.24 without stretching the band. This lines up neatly with where the EMA200 also resides — a confluence zone that matters if bulls aim to make real progress.
Daily ATR14 registers at $0.02, which against a $0.22 price translates to roughly 9% of spot. That is not a sleepy market. Moves of that magnitude can unfold fast in either direction, so position sizing and stop placement must respect that volatility. Pivot levels are tight: pivot at $0.22, resistance R1 at $0.23, support S1 at $0.22. Price sitting on top of its own pivot often precedes a decisive move once one side takes control.
Hourly and 15-Minute: Where the Bullish Tilt Shows Up
The 1H chart offers a more constructive read because the regime is tagged outright bullish. EMA20 at $0.22 sits above EMA50 at $0.21 and EMA200 at $0.21 — a clean stacked alignment that intraday traders prioritize. RSI14 at 57.8 confirms mild bullish momentum without pushing into overbought territory. The MACD, however, remains flat, mirroring the daily hesitation and signaling that even the bullish timeframe has not fully committed.
Bollinger Bands on the 1H are extremely tight, with the mid-band at $0.22, upper at $0.23, and lower at $0.22. This compression typically signals an impending expansion move — the market is coiling, and low volatility rarely persists on crypto charts for long.
Drop to the 15-minute chart and the picture cools off: regime reads neutral, RSI14 at 44.94 sits just below the midpoint. This is a normal short-term breather within the broader hourly bullish tilt, not a reversal signal. It is best used for execution timing rather than as a directional call on its own. The tension between timeframes — daily neutral with a bullish lean, hourly bullish, 15-minute pausing — is not contradiction so much as a market building energy in stages.
On-Chain Backdrop: Ecosystem Activity Is Heating Up
On-chain activity across Cardano’s DEX ecosystem has surged in ways that complement the technical outlook. Minswap DEX fees jumped 166.51% in a single day, while WingRiders spiked an eye-catching 1,266.18% over 24 hours and is up 803.35% over seven days.
Meanwhile, SundaeSwap V2 rose 300.03% daily with a 548.23% weekly gain, Dano Finance climbed 536.69% in a day, and Splash Protocol added 203.4% daily. A broad-based spike like this across multiple platforms signals genuine on-chain usage growth — the kind of fundamental tailwind that can support price action even if it does not move markets instantly.
Bullish and Bearish Scenarios for $ADA
The bullish case builds if $ADA clears the $0.23 resistance with conviction and pushes through the $0.24 zone where the daily EMA200 and upper Bollinger Band converge. A daily close above that level would flip the daily regime from neutral to genuinely bullish. Combined with the hourly bullish EMA stack and the Greed-heavy sentiment backdrop — the Fear & Greed Index reads 74 — that kind of breakout could attract fresh momentum buying.
The bearish case activates if $ADA loses the $0.22 pivot and slides back toward the EMA50 at $0.19, or worse, tests the lower Bollinger Band near $0.17. That would confirm the daily EMA200 ceiling at $0.24 is holding firm and that the recent bounce was merely a relief move inside a larger downtrend. Moreover, a flat MACD on both daily and hourly timeframes means momentum has not committed to buyers yet, so a failure to hold $0.22 would not surprise if broader sentiment cools.
What invalidates each side is fairly clean: the bullish scenario fails with a daily close back below the EMA20 at $0.20, which would suggest the recovery has stalled. Conversely, the bearish scenario is invalidated by a daily close above the EMA200 at $0.24 on rising volume — the clearest signal yet that $ADA has shifted out of its current range.
Positioning and Risk
Right now, $ADA sits at a decision point rather than inside a clear trend. The daily chart is neutral, the hourly leans bullish, and the 15-minute is cooling — not a setup that rewards aggressive conviction. With daily ATR running near 9% of spot, moves can unfold quickly once the pivot zone breaks. Traders watching this chart should focus on levels and confirmation rather than assumptions. The setup is there for a real move; which direction it resolves in remains an open question.
FAQ
What is Cardano’s price today?
As of September 4, 2026, Cardano trades at $0.22, sitting almost exactly on its daily pivot point. The price is above the EMA20 at $0.20 and EMA50 at $0.19 but remains below the EMA200 at $0.24, which keeps the daily chart in neutral territory.
Is Cardano’s daily chart bullish or bearish?
The daily chart is officially neutral. RSI14 at 63.05 leans bullish and price trades above the short-term moving averages, but the EMA200 at $0.24 continues to cap upside. A daily close above that level would flip the regime to bullish.
What are the key resistance and support levels for $ADA?
Key resistance sits at $0.23 (R1) and the $0.24 zone where the daily EMA200 and upper Bollinger Band converge. Support holds at the $0.22 pivot, with deeper levels at the EMA50 near $0.19 and the lower Bollinger Band at $0.17.
Why are Cardano DEX fees spiking?
Multiple Cardano-based DEXs including Minswap, WingRiders, SundaeSwap V2, Dano Finance, and Splash Protocol recorded triple-digit or even four-digit percentage daily fee increases, suggesting a genuine uptick in on-chain usage across the ecosystem rather than isolated activity.
Disclaimer: This article is for informational purposes only and does not constitute financial advice, an investment recommendation, or a solicitation to buy or sell any financial instrument or cryptocurrency. The analysis provided is not indicative of future results. Investing in crypto assets and financial markets carries a high risk of capital loss. Always do your own research (DYOR) and consult a qualified financial advisor before making any decision.
Article produced with the assistance of artificial intelligence and reviewed by the editorial team.