
 en.cryptonomist.ch

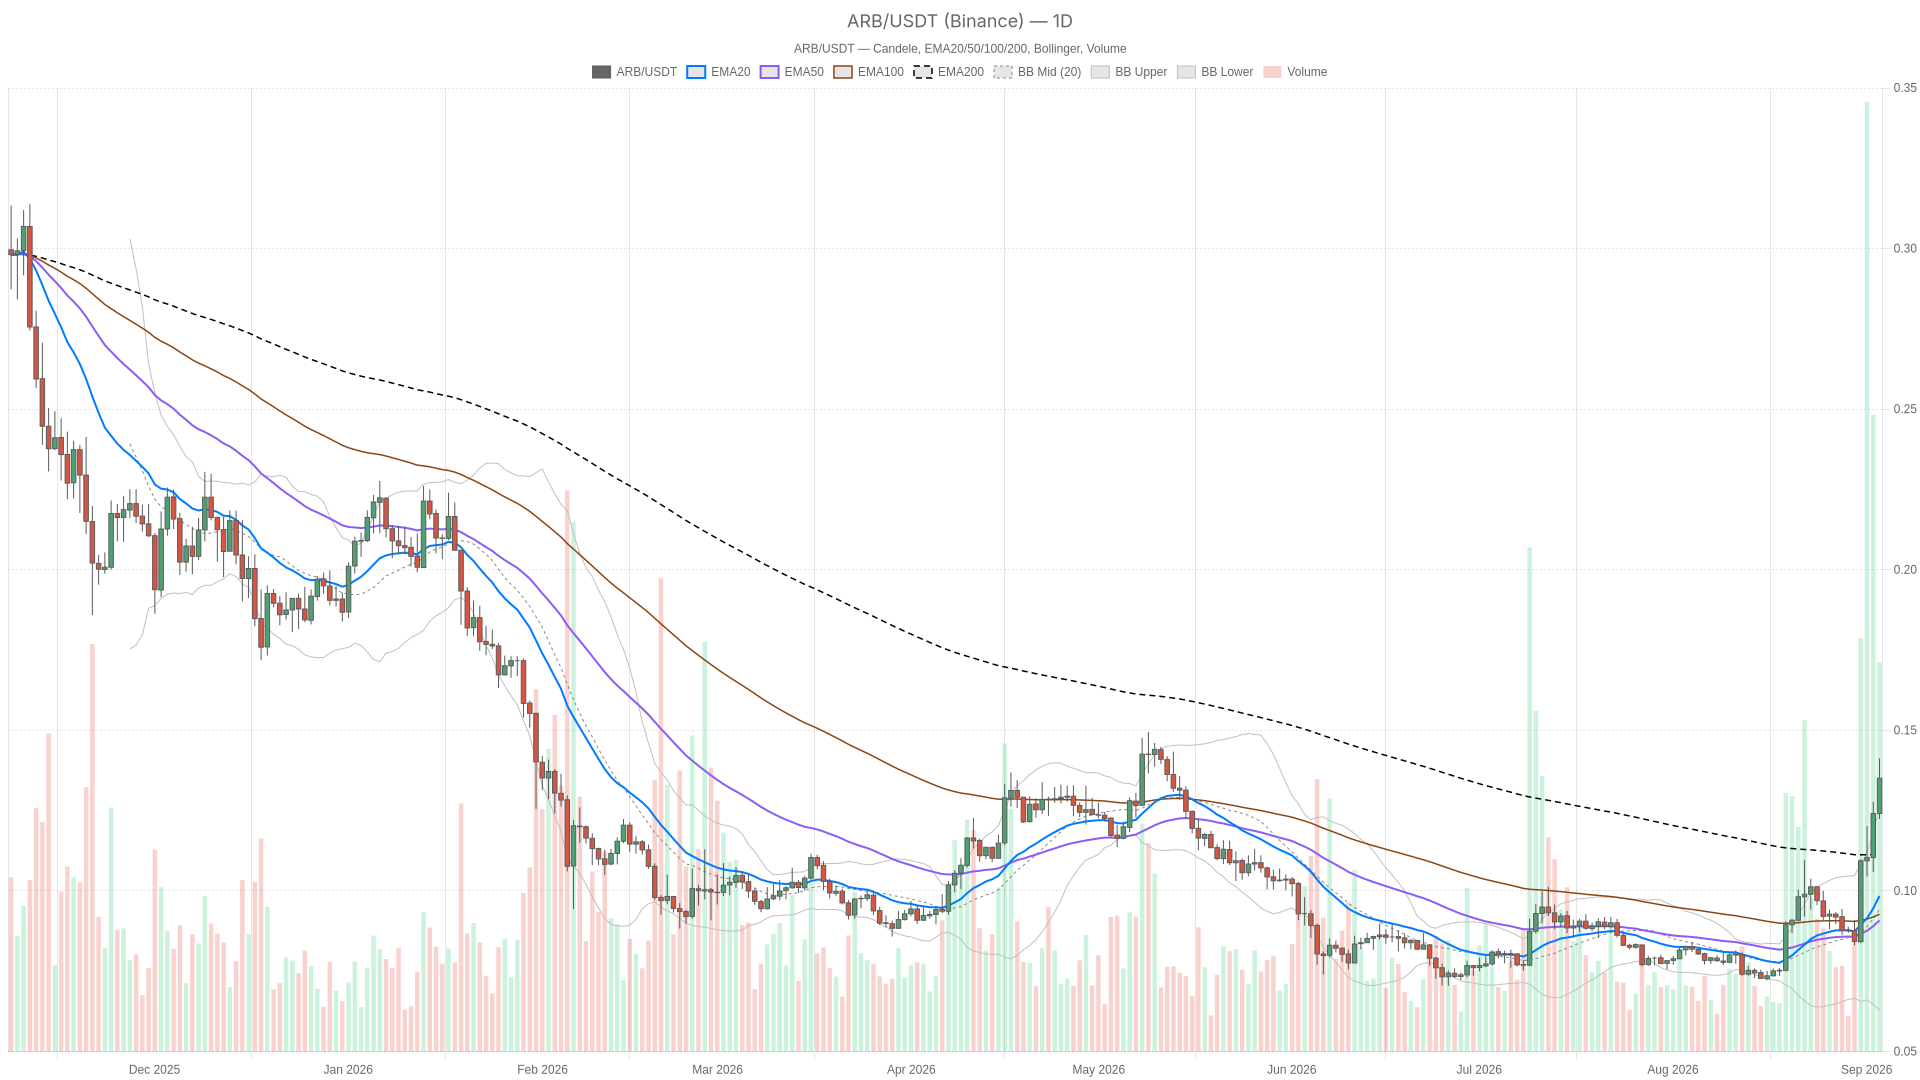
As of September 3, 2026, Arbitrum crypto trades at 0.14, sitting on its daily resistance pivot and pushing outside its daily Bollinger Band. The tension is clear: the daily chart flashes overbought conditions while shorter timeframes remain structurally healthy, and that disagreement demands caution before picking a side.
Key takeaways
- $ARB/$USDT trades at 0.14 on September 3, 2026, sitting directly on its daily resistance pivot
- Daily RSI has reached 80.08, signaling deeply overbought conditions with price above the upper Bollinger Band
- Bitcoin dominance remains elevated at 59.2%, offering limited tailwind for altcoins
- On-chain activity on Camelot V3 shows fees up 139.77% over 30 days
- The hourly trend remains structurally bullish, but momentum indicators are beginning to cool
The broader backdrop, however, offers limited conviction either way. Total crypto market capitalization sits near $2.68 trillion, down 0.40% over 24 hours, while Bitcoin dominance holds at roughly 59.2%. Capital has not rotated aggressively into altcoins, which matters for $ARB. Its strength is occurring without a generous altcoin tailwind. The Fear & Greed Index reads 65, signaling appetite for risk without euphoric froth. $ARB’s recent push appears more asset-specific than market-driven.
Daily Chart Paints a Conflicted Picture Above All Moving Averages
The daily chart shows $ARB stretched above every moving average, yet the 200-period EMA sits above both the 20 and 50 — meaning the long-term trend has not yet flipped bullish. This is an impulsive breakout, not a mature trend, and the structure remains fragile until the averages realign.
On the daily timeframe, price at 0.14 trades above all three EMAs: the 20-period at 0.10, the 50-period at 0.09, and the 200-period at 0.11. At first glance this appears unambiguously bullish. However, the 200 EMA sits above both shorter averages, confirming the longer-term structure has not confirmed an uptrend. What has occurred is a sharp, fast move cutting through resistance levels quicker than the averages could catch up. This is the hallmark of an impulsive breakout rather than a mature trend.
The daily RSI closes at 80.08, about as stretched as this indicator gets. Price pushes above the upper Bollinger Band at 0.13, versus a mid-band of 0.09 and lower band of 0.06. Bands this wide signal that volatility has expanded quickly. The daily MACD line and signal both sit at 0.01 with a flat histogram, meaning momentum has stopped accelerating even as price stays elevated. That kind of stall often serves as an early warning that buyers are tiring. The system still tags the daily regime as neutral.
Daily pivots place the pivot point at 0.13, resistance R1 at 0.14, and support S1 at 0.12. Price is camped almost exactly at R1. The ATR14 of 0.01 is not huge in absolute terms, but relative to a 0.14 price it represents a meaningful chunk of daily range. A rejection from this zone could move fast in either direction.
Intraday Timeframes Stay Bullish but Show Signs of Cooling
The hourly and 15-minute charts remain structurally bullish, with EMAs stacked correctly for an uptrend, but momentum indicators have begun to decelerate — suggesting the rally is losing steam even before price has reversed.
On the 1-hour chart, EMAs are stacked correctly: 20 at 0.13, 50 at 0.12, and 200 at 0.10 — the regime reads bullish. RSI at 63.18 remains firm without being extreme, a healthier reading than the daily’s 80-plus. However, the MACD line has dipped just under the signal line, a small crack suggesting momentum is decelerating. Price holds near the top of its hourly Bollinger Band at 0.14, while the mid-band sits at 0.13. Hourly pivot resistance also lands at 0.14, stacking two timeframes of resistance on top of each other.
The 15-minute chart tells a similar story of cooling rather than reversing. EMAs remain bullishly stacked (0.14, 0.13, 0.12), and the regime is still bullish. However, RSI has settled to 50.98 — essentially neutral — and the MACD has gone flat across line, signal, and histogram. This is consistent with a market that spiked and is now digesting sideways near the highs. Bollinger Bands have compressed tightly between 0.13 and 0.14, which usually precedes a volatility expansion.
What Would Confirm the Bullish Case for Arbitrum crypto
For the bullish scenario to gain credibility, $ARB must clear and hold above 0.14 — where daily R1, hourly upper band, and 15-minute pivot resistance all converge.
For continuation to be credible, Arbitrum crypto needs to clear and hold above the shared resistance cluster at 0.14. Daily R1, the hourly upper band, and 15-minute pivot resistance all converge at this level. A daily close above the upper Bollinger Band rather than a snapback inside it would signal genuine trend expansion rather than a one-off spike.
On the fundamentals side, activity on Camelot V3 — Arbitrum’s native decentralized exchange — has picked up notably. Fees are up 139.77% over 30 days and 18.3% over the past week, even though the most recent daily reading pulled back sharply. If on-chain engagement keeps building, it gives the bullish technical picture real substance beyond momentum.
What Would Confirm the Bearish or Mean-Reversion Case
The bearish case rests on the daily chart’s extremes: an RSI above 80, a close outside the upper Bollinger Band, and a flat MACD histogram are classic ingredients for a snapback toward the mean.
The case against chasing strength, however, is built on the daily extremes. An RSI above 80, a close outside the upper Bollinger Band, and a flat MACD histogram are classic snapback ingredients. If $ARB loses shared support around 0.12 to 0.13, the next magnet becomes the daily 20 and 50 EMAs at 0.10 and 0.09. The Bollinger mid-band near 0.09 also sits within reach. That both the hourly MACD and 15-minute RSI are already cooling before price has broken down deserves attention. Momentum often fades before price does.
Reading the Setup Without Overcommitting
This is a market where timeframes genuinely disagree — the daily chart signals overextension while intraday charts remain bullish but tiring — and the healthiest approach is letting price reveal its hand at key levels.
This is a market where timeframes genuinely disagree, and pretending otherwise would be dishonest. The daily chart says overextended; the hourly and 15-minute charts say bullish but tiring. Positioning around a setup like this means respecting the size of the potential move — the daily ATR is not trivial relative to a 0.14 price — and the possibility that neither scenario plays out cleanly.
That said, broader market conditions offer $ARB little tailwind, with Bitcoin dominance still elevated near 59.2% and total market cap essentially flat. This puts more weight on Arbitrum’s own on-chain activity and price behavior at key levels. Volatility can cut either way fast here. The healthiest approach is to let the market show its hand at the 0.14 resistance and 0.12 to 0.13 support zones rather than assuming the answer in advance.
FAQ
What is $ARB’s current price?
As of September 3, 2026, $ARB/$USDT is trading at 0.14, sitting directly on its daily resistance pivot.
Is $ARB overbought on the daily chart?
Yes, the daily RSI reads 80.08 and price is pushing above the upper Bollinger Band, both signaling deeply overbought conditions. However, intraday timeframes remain structurally bullish, creating a tension between timeframes.
What are the key levels for $ARB/$USDT?
Key resistance sits at 0.14, where daily R1, the hourly upper Bollinger Band, and 15-minute pivot resistance converge. Support lies between 0.12 and 0.13, with the daily 20 and 50 EMAs at 0.10 and 0.09 serving as deeper downside magnets.
What is driving Arbitrum’s recent on-chain activity?
Activity on Camelot V3, Arbitrum’s native decentralized exchange, has picked up notably, with fees rising 139.77% over 30 days and 18.3% over the past week, suggesting genuine ecosystem engagement behind the price move.
Disclaimer: This article is for informational purposes only and does not constitute financial advice, an investment recommendation, or a solicitation to buy or sell any financial instrument or cryptocurrency. The analysis provided is not indicative of future results. Investing in crypto assets and financial markets carries a high risk of capital loss. Always do your own research (DYOR) and consult a qualified financial advisor before making any decision.
Article produced with the assistance of artificial intelligence and reviewed by the editorial team.