
 u.today

Although Shiba Inu's price chart appears to be stabilizing, one of its most recent exchange metrics presents a potentially unfavorable development for the bullish scenario. A significant decrease in $SHIB's average exchange outflows is the primary shift. At roughly 261.7 million $SHIB, the seven-day moving average of mean exchange outflows has decreased by 75.55%.
Exchange outflows slow down
Tokens leaving trading platforms for private wallets are typically linked to exchange outflows. Therefore, significant outflows may be a sign of accumulation or decreased sell-side liquidity that is readily available. A 75% contraction indicates a significant weakening of this potential accumulation source.
The development gains significance in relation to inflows. The seven-day moving average of mean inflows increased by 24.13% to 595.68 million $SHIB, while total exchange inflows increased by 1.48% to about 398.35 billion $SHIB. Put differently, there has been a shift in the short-term exchange balance from withdrawals to deposits.
Additionally, $SHIB's exchange reserve grew by 0.29%, reaching roughly 87.21 trillion tokens. Although having more tokens on exchanges does not ensure that they will be sold, it does increase the amount of $SHIB that holders may be able to sell right away. It is interesting to note that overall exchange netflow decreased by 10.29%, indicating that the data does not suggest a complete capitulation event.
Pressure being absorbed
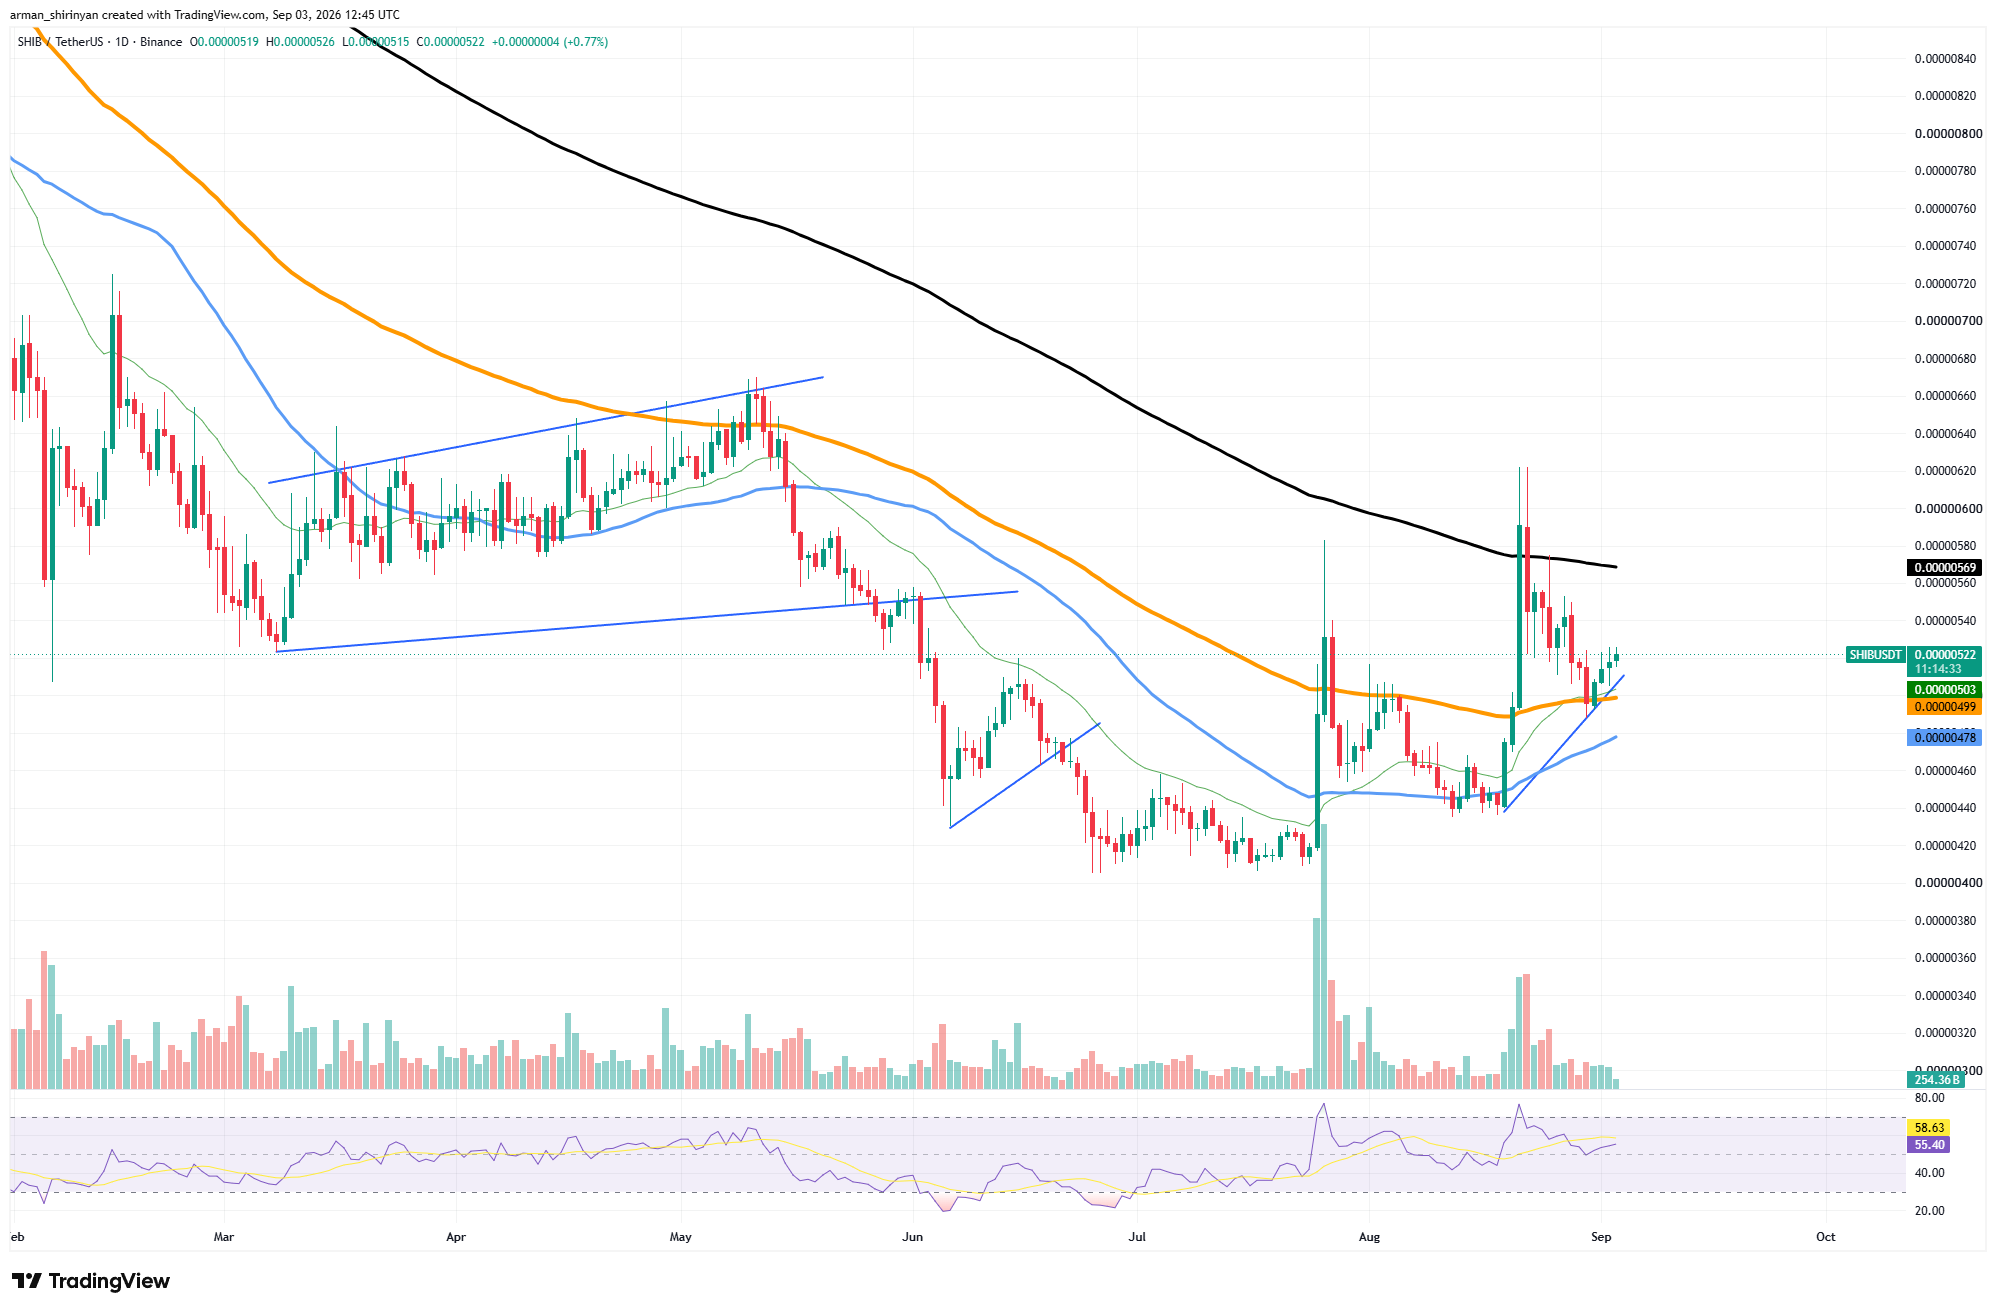
Rather, the divergence between increasing inflow activity and falling average outflows is a more significant signal. Thus far, $SHIB's price structure has done a fair job of absorbing the pressure. Above the cluster of shorter moving averages around $0.00000503–$0.00000499, the token trades at approximately $0.00000524. Additionally, the rising trendline from August lows is still in place.
The next significant barrier is located at $0.00000569, which corresponds to the 200-day moving average. The overall technical structure would be significantly improved by surpassing that threshold.
$SHIB is still in recovery territory for the time being, but one of the signals that bulls would prefer to see is weakened by the 75.55% outflow collapse. As a result, holding $0.00000500 is becoming more crucial. While persistent strength above current levels would keep another attempt at $0.00000569 in the running, a breakdown could reveal the 50-day moving average near $0.00000478.