
 en.cryptonomist.ch

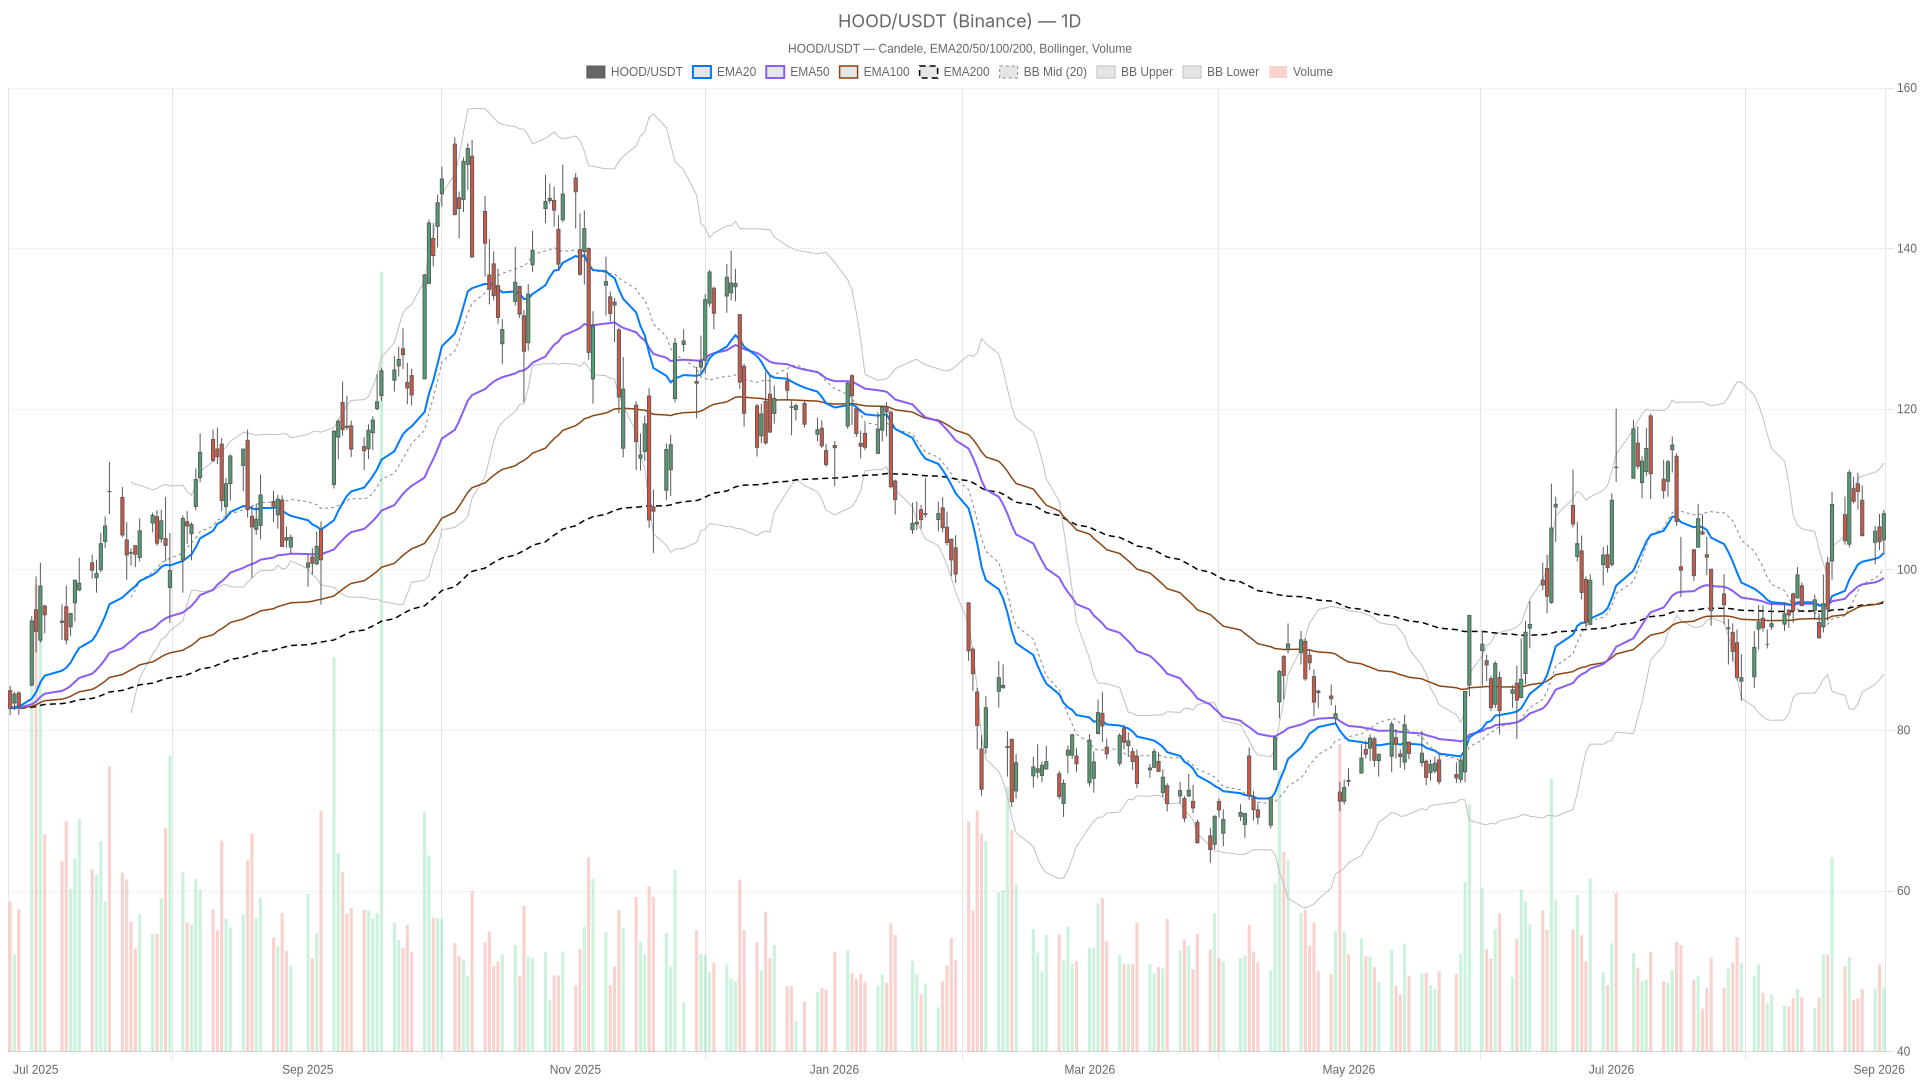
Robinhood stock closed Wednesday at $106.99, up sharply from an open near $103.72, after touching an intraday high of $107.46. The daily chart confirms a clear uptrend with buyers firmly in control. Volume of roughly 16.66 million shares supports the move’s strength.
Key takeaways
- Robinhood stock closed at $106.99 with a bullish daily structure firmly intact.
- Daily RSI at 56.53 leaves considerable room before reaching overbought territory.
- Morgan Stanley upgraded HOOD to Overweight, citing underestimated revenue potential.
- The near-term resistance cluster sits at $107.37–$107.40, a key intraday battleground.
- Daily ATR14 of 6.26 signals elevated volatility, meaning sharp moves remain possible.
Daily Trend Structure Favors the Bulls
The daily trend structure is unambiguously bullish, with Robinhood stock trading above all three key moving averages in a textbook stacked alignment.
Moving Average Alignment Reinforces the Trend
Price sits comfortably above the EMA20 at 102.09, the EMA50 at 98.97, and the EMA200 at 95.89. That stacked formation—short-term above medium-term above long-term—is a classic bullish signal. It confirms this is not a short-lived bounce but a trend that has been building for some time.
Momentum and Volatility Leave Room to Run
The daily RSI reads 56.53, comfortably in bullish territory but nowhere near overbought. That leaves room for the rally to extend before momentum becomes stretched. Meanwhile, the MACD line at 2.54 sits well above its signal line at 1.78, producing a positive histogram of 0.76. Momentum, in other words, is accelerating.
Bollinger Bands show the mid-band at 100.15, with the upper band at 113.29 and the lower band at 87.02. Price near $107 places HOOD well above the midline, with room left before testing the upper boundary. The daily ATR14 of 6.26 confirms elevated volatility—typical of a stock in an active directional move. Meanwhile, the daily pivot sits at 105.45, with resistance at 109 (R1) and support at 103.43 (S1). Trading above the pivot is a bullish signal, and R1 at 109 becomes the next logical test.
Hourly Momentum Confirms the Daily Bias
The hourly chart reinforces the daily bullish thesis, with all three EMAs stacked bullishly beneath the current price of 107.02.
EMA20 at 105.67, EMA50 at 105.39, and EMA200 at 102.37 all sit below price. The hourly RSI at 55.76 mirrors the daily reading almost exactly. This suggests momentum is consistent across timeframes rather than diverging.
Notably, the hourly MACD line at 0.06 has just crossed above its signal line at -0.3, producing a histogram of 0.36. This early-stage bullish crossover adds confirmation to the daily setup.
However, the hourly Bollinger Bands tell a more cautious short-term story. With the mid-band at 105.01 and the upper band at 107.6, price trades very close to the upper boundary. That proximity suggests the stock could pause or consolidate in the near term.
The hourly pivot at 106.84, with R1 at 107.39 and S1 at 106.47, places price right at the pivot resistance zone—a level worth watching closely.
15-Minute Chart Offers Execution Clues
The 15-minute chart shows stronger short-term momentum, with RSI14 at 63.52, though the MACD histogram hints the immediate push may be losing steam.
The 15m RSI at 63.52 is the highest reading across all three timeframes, signaling short-term buying pressure has picked up into the close. At the same time, the 15m MACD histogram has narrowed to just 0.09, down from a line of 0.46 versus a signal of 0.37. This modest deceleration suggests the immediate move higher may be fading slightly.
The 15m Bollinger Bands are tight. The mid-band sits at 105.99 and the upper band at just 107.03—essentially where price is trading. Band compression near the upper boundary often precedes either a sharp continuation or a short consolidation phase. The 15m pivot at 106.86, with R1 at 107.37, aligns closely with the hourly resistance zone. This reinforces $107.30–$107.40 as a near-term battleground for intraday traders.
News Flow Adds Fundamental Support
The technical setup receives reinforcement from the news cycle, headlined by a Morgan Stanley upgrade of Robinhood stock to Overweight from Equal Weight.
Analyst Michael Cyprys cited the view that investors may be underestimating the company’s ability to generate additional revenue from its existing customer base. That is a meaningful vote of confidence from a major sell-side desk. It lines up neatly with the bullish price action seen on the daily chart.
Meanwhile, retail sentiment appears to be shifting in Robinhood’s favor. Traders on platforms like Stocktwits have been naming Robinhood as a preferred fintech play over SoFi Technologies. Robinhood also continues to dominate retail attention as a trading venue, with Nvidia remaining the platform’s most-held stock. On the institutional side, Artisan Partners’ Global Opportunities Strategy flagged Robinhood as an attractive holding, adding another layer of interest.
However, not all coverage is unambiguously bullish. The Motley Fool highlighted that Robinhood’s direct exposure to crypto transaction revenue cuts both ways. Shifts in customer trading behavior toward or away from crypto can swing results significantly. That is a fair reminder that the company’s revenue mix carries its own volatility.
Bullish Scenario: Break and Hold Above $107.40
For the bullish case to keep playing out, HOOD needs to clear the resistance cluster around $107.37–$107.39.
A daily close above the pivot resistance at 109 would validate the next leg higher. The daily RSI, still below overbought extremes, supports this outcome. Continued positive news flow—including the Morgan Stanley upgrade and favorable retail positioning—would likely support follow-through buying. If the daily MACD histogram continues expanding, that would signal the uptrend has further room before facing meaningful resistance near the upper Bollinger Band at 113.29.
Bearish Scenario: Rejection at Resistance and Momentum Fade
The bearish risk centers on a rejection at the current resistance cluster. If price fails to clear $107.39 and instead rolls over, the narrowing 15-minute MACD histogram could be an early warning.
A drop below the daily pivot at 105.45 would weaken the immediate bullish structure. A break of the hourly S1 at 106.47 would suggest short-term sellers are gaining control. The broader bullish thesis would be invalidated by a daily close below the EMA20 at 102.09. That would signal the trend itself is losing conviction rather than simply consolidating.
Closing Thoughts
Overall, Robinhood stock enters this stretch with daily, hourly, and 15-minute indicators all aligned bullishly. It is a rare instance where every timeframe tells a consistent story. Therefore, the path of least resistance still points higher, provided price clears the resistance band just above current levels. However, elevated volatility—reflected in the daily ATR14 of 6.26—means sharp moves in either direction remain possible. Positioning should account for the proximity to resistance and the natural uncertainty of a stock trading near the upper end of its recent range.
FAQ
What is the near-term resistance level for Robinhood stock?
The near-term resistance cluster sits at $107.37–$107.40, aligned across both hourly and 15-minute timeframes. A break above this zone would open the path toward the daily pivot resistance at $109.
Is Robinhood stock overbought right now?
No, the daily RSI reads 56.53, which is comfortably in bullish territory but well below overbought levels typically associated with the 70 threshold. This leaves room for the rally to extend.
What is the key support level for HOOD?
The key support levels are the daily pivot at $105.45 and the hourly S1 at $106.47. A break below the EMA20 at $102.09 would be the invalidation point for the broader bullish thesis.
What did Morgan Stanley say about Robinhood?
Morgan Stanley analyst Michael Cyprys upgraded Robinhood stock to Overweight from Equal Weight, citing the view that investors may be underestimating the company’s ability to generate additional revenue from its existing customer base.
Disclaimer: This article is for informational purposes only and does not constitute financial advice, an investment recommendation, or a solicitation to buy or sell any financial instrument or cryptocurrency. The analysis provided is not indicative of future results. Investing in crypto assets and financial markets carries a high risk of capital loss. Always do your own research (DYOR) and consult a qualified financial advisor before making any decision.
Article produced with the assistance of artificial intelligence and reviewed by the editorial team.