
 coinedition.com

Dogecoin enters September 2026 at a key turning point. $DOGE is trading at a level where a multi year support trend line meets resistance, and that level is very important for its next move.
Dogecoin Price Analysis: Will $DOGE Break Its Two-Year Trendline?
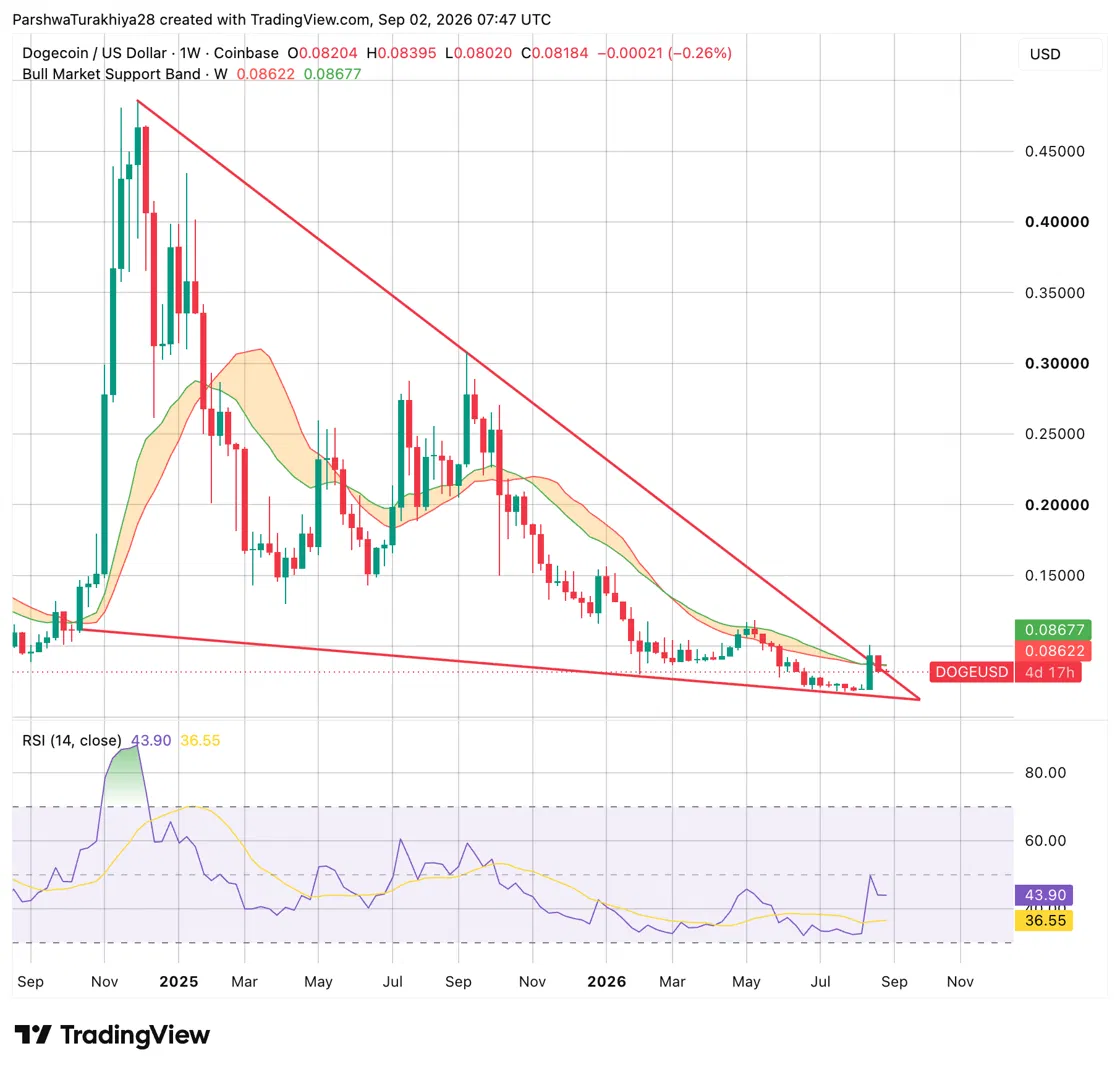
$DOGE trades near $0.0817, essentially flat after closing the week down just 0.26%. The number matters less than where it sits, right at the apex of a triangle that has been building since late 2024, where a descending resistance line from the $0.48 high meets a less steep support trend that extends back to the beginning of 2024. The price of September opened practically on this level.
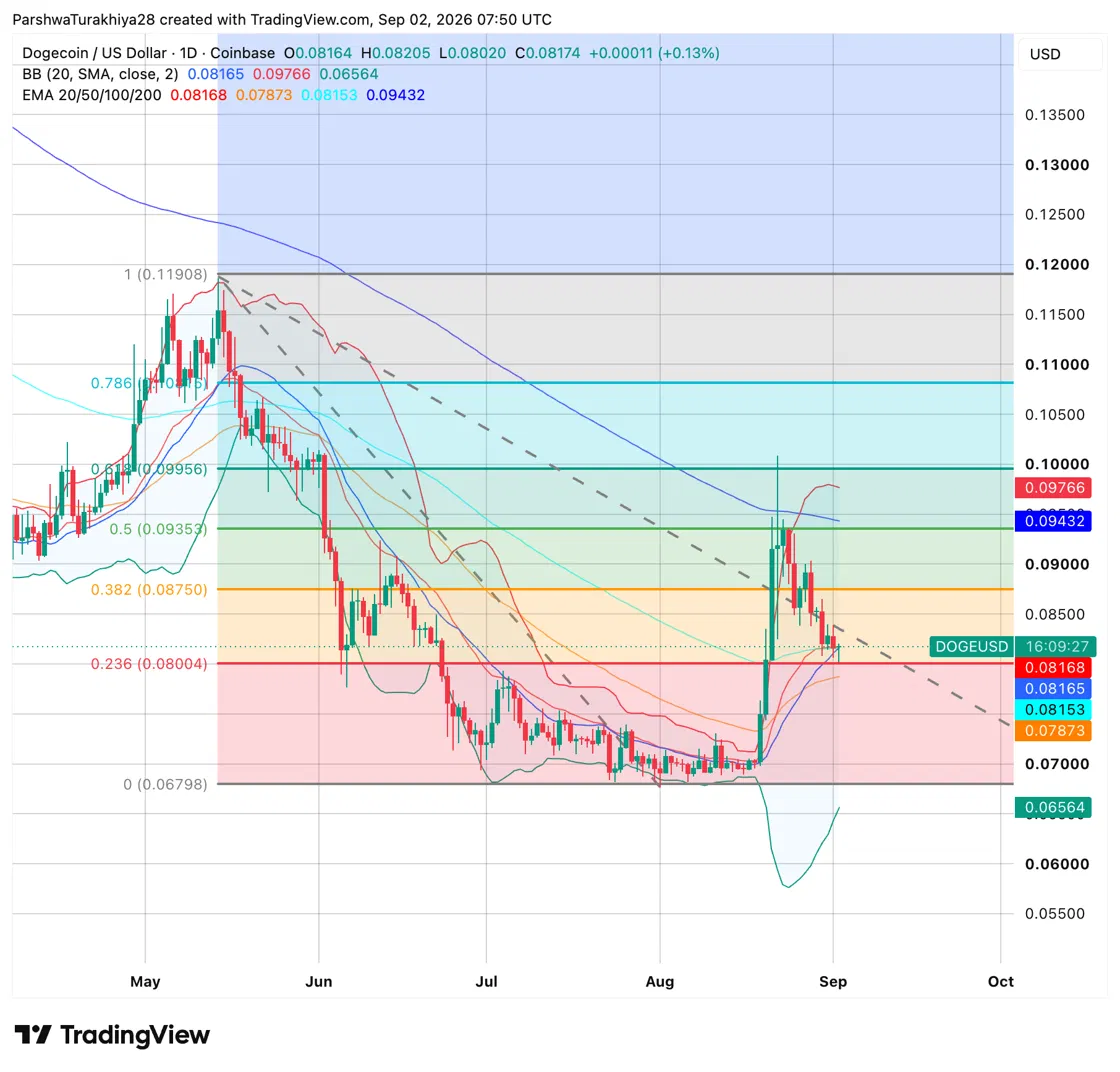
The daily chart shows just how tightly price is being squeezed. It is trading between the 20-day EMA at $0.08168 and the 100-day EMA at $0.08153, while the 200-day EMA at $0.09432 remains the bigger resistance level.
Related: Uniswap Price Prediction September 2026: UNI Eyes $8 After Trendline Breakout
The 0.236 Fibonacci level at $0.08004 is also close to the current price. Above that, the weekly Bull Market Support Band between $0.08622 and $0.08677 is the next area buyers need to clear. Meanwhile, RSI has risen from its recent lows but remains below neutral at 43.90.
$DOGE Support and Resistance Levels, September 2026
| Type | Price |
| Resistance | $0.0868 |
| Resistance | $0.0943 |
| Resistance | $0.1048 |
| Support | $0.0800 |
| Support | $0.0787 |
| Support | $0.0680 |
Dogecoin News: Analyst Says the $15 Dogecoin Thesis Is Dead
THE $15 DOGECOIN THESIS
— Ali Charts (@alicharts) September 1, 2026
The $15 Dogecoin target was never based on speculation.
It was based on a rising parallel channel that had accurately defined Dogecoin's price action since inception.
Every touch of the channel's lower boundary had marked a generational buying… pic.twitter.com/xKakE7JD3Q
Analyst Ali Martinez said the old $15 Dogecoin target was built on a rising parallel channel that had defined $DOGE’s price action since it launched, with every touch of the channel’s lower boundary marking a major buying opportunity, including gains of 9,221% in 2017 and 30,694% in 2020.
Related: Filecoin Price Prediction September 2026: FIL Eyes $0.93 Resistance After Sharp Recovery
When $DOGE returned to that same support in February 2026, the setup pointed to the possibility of another run with $15 as the projected target. Ali Charts said $DOGE has since broken below that channel, removing the technical basis for the $15 thesis.
Dogecoin Derivatives: Are Longs Getting Squeezed?
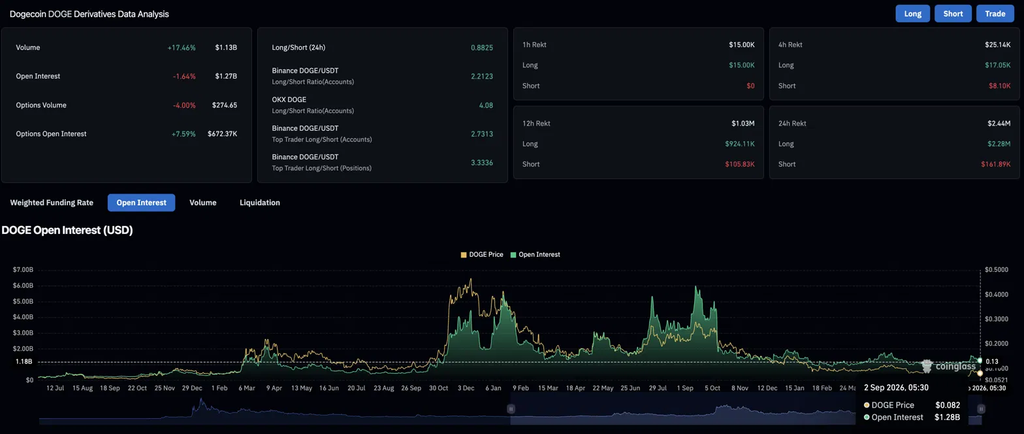
$DOGE derivatives volume climbed 17.46% to $1.13 billion in the past 24 hours. Open interest slipped 1.64% to $1.27 billion, so part of that volume was traders exiting rather than new money coming in.
Longs are absorbing the losses. $2.28 million in long positions got liquidated over the past 24 hours, against just $161,890 in shorts. Despite that, traders keep adding to long positions, Binance’s long/short ratio sits at 2.21 and OKX runs even higher at 4.08. That mismatch, rising longs alongside rising long liquidations, usually shows up when a market is trying to call a bottom too early rather than trading a confirmed reversal.
| Metric | Value | What it shows |
| Derivatives volume (24h) | $1.13B, up 17.46% | Trading activity picking up |
| Open interest | $1.27B, down 1.64% | Some traders closing out despite the volume increase |
| Binance long/short ratio | 2.21 | Traders still leaning long despite the losses |
| 24h long liquidations | $2.28M of $2.44M total | Longs are taking almost all the pain |
September Seasonality: How Has $DOGE Performed Historically?
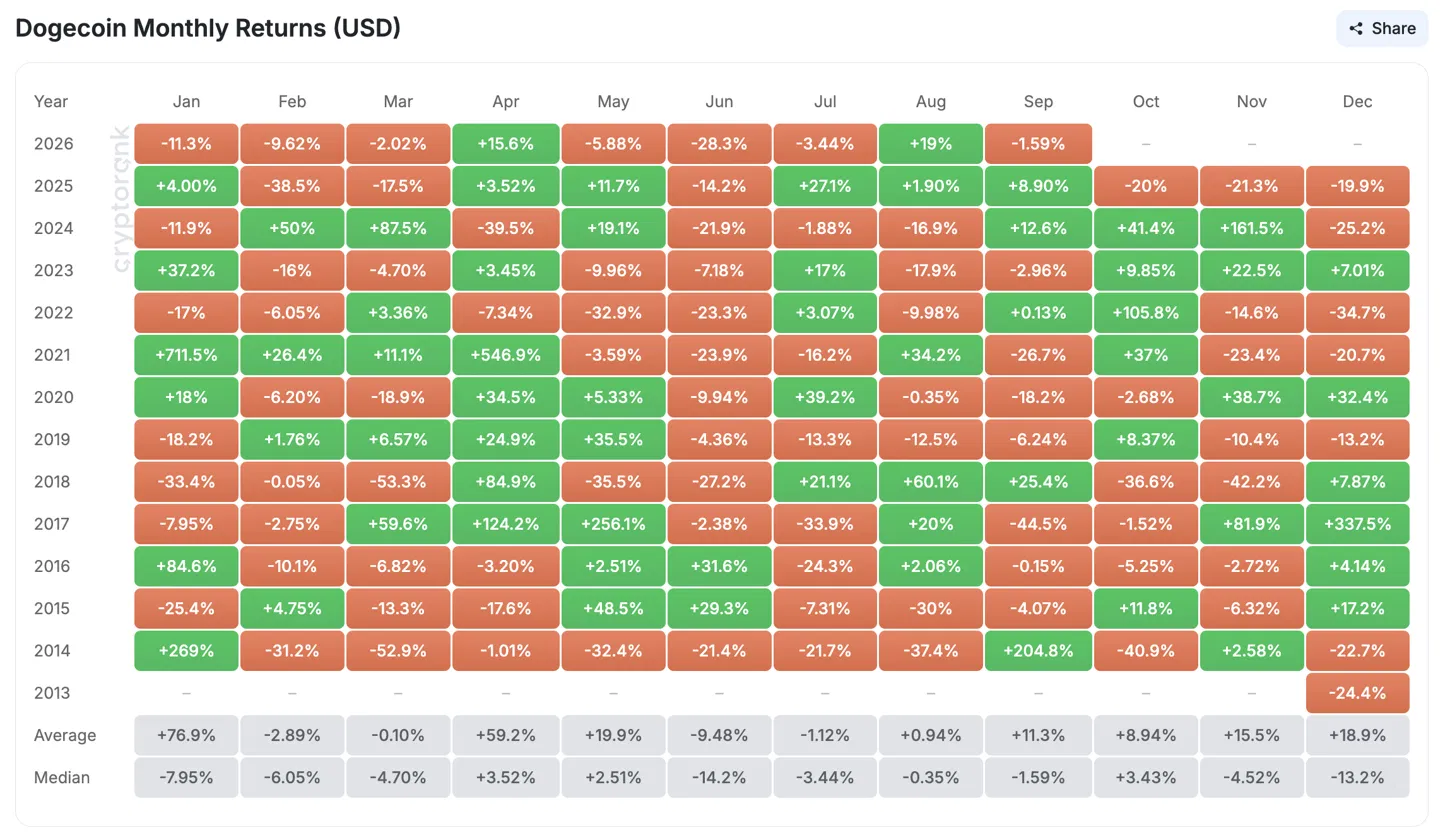
$DOGE’s September returns swing hard depending on the year. 2014 alone returned better than 200%, which pulls the average for the month above 11%. Strip that out and the typical September looks far more modest, the median return actually sits negative, according to data compiled by CryptoRank.
| Year | Return |
| 2026 | -1.59% |
| 2025 | +8.90% |
| 2024 | +12.6% |
| 2023 | -2.96% |
| 2022 | +0.13% |
| 2021 | -26.7% |
| 2020 | -18.2% |
| 2019 | -6.24% |
| 2018 | +25.4% |
| 2017 | -44.5% |
| 2016 | -0.15% |
| 2015 | -4.07% |
| 2014 | +204.8% |
| Average | +11.3% |
| Median | -1.59% |
Week-by-Week Price Forecast for September 2026
| Period | Price Range | Key Level |
| Week 1 (Sep 1-7) | $0.079 – $0.087 | Price sits at the triangle apex, the make-or-break zone for the month |
| Week 2 (Sep 8-14) | $0.075 – $0.090 | A close above $0.087 opens the Bull Market Support Band retest |
| Week 3 (Sep 15-21) | $0.078 – $0.094 | Reclaiming the 200-day EMA at $0.0943 keeps the bullish path alive |
| Week 4 (Sep 22-30) | $0.068 – $0.100 | Wide range reflects the fork, breakdown risk to $0.068 versus upside to $0.10 if EMA200 clears |
Dogecoin Price Prediction September 2026: Upside and Downside Targets
Bullish Case, Target: $0.10
$DOGE holds the $0.080 trendline confluence and reclaims the weekly Bull Market Support Band at $0.0868. A close above the 200-day EMA at $0.0943 would confirm the reversal and open room toward the 0.786 Fibonacci level near $0.10.
Bearish Case, Risk Level: $0.068
$DOGE breaks below the $0.080 apex, invalidating the support side of the triangle just as Ali Charts flagged the failure of the longer-term channel behind the $15 thesis. That combination exposes the August low near $0.068, $DOGE’s last major support before the year’s low.
Expert Insight
$DOGE has no burn mechanism, no ETF flow, no protocol upgrade behind this chart, unlike most of the other majors moving right now. That makes this triangle less a read on Dogecoin and more a read on whether risk appetite is coming back to crypto broadly. Bitcoin’s own levels this month probably matter more to how this resolves than anything on the $DOGE chart itself.
Positioning is the other tell. Open interest is shrinking into a level this obvious, when usually traders load up ahead of a decision point everyone can see coming. Thin positioning going into a breakout or breakdown tends to mean the move happens fast, since there’s no wall of opposing size on the other side to absorb it.
Dogecoin Price Prediction FAQs
$DOGE could rise toward $0.10 if it holds the trendline confluence near $0.080 and reclaims the Bull Market Support Band at $0.0868. Losing $0.080 risks a drop toward $0.068.
$DOGE opened September almost exactly where a multi-year descending resistance line meets a flatter support line, making this level the pivot point for the whole month.
Ali Charts said $DOGE broke below the parallel channel that supported the original $15 thesis, removing the technical basis for that target.
Traders remain positioned long on Binance and OKX, but long positions absorbed $2.28 million in liquidations over the past 24 hours versus $161,890 for shorts, showing longs are under pressure despite the bullish positioning.