
 en.cryptonomist.ch
As of September 1, 2026, $XRP trades at $1.37. The Ripple price today reflects a clash between a bullish daily structure and softening intraday momentum. The coming sessions could prove decisive.
Key takeaways
- $XRP closed at $1.37 on September 1, 2026, holding above all three major daily EMAs
- Daily RSI at 60.69 leaves room for further upside without approaching overbought levels
- Hourly and 15-minute charts show bearish momentum with RSI readings below 50
- Total crypto market cap fell 2.95% to $2.62 trillion as Bitcoin dominance rose to 59.59%
- A daily close below the $1.33 EMA200 would signal a structural trend break
The broader crypto market offers little clarity. Total market capitalization slipped 2.95% over the past 24 hours to roughly $2.62 trillion, according to CoinGecko, while Bitcoin dominance climbed to 59.59%. That combination typically signals capital rotating away from altcoins and into Bitcoin, or simply exiting risk altogether.
$XRP’s intraday weakness aligns neatly with that backdrop. Meanwhile, the Fear & Greed Index reads 69, classified as “Greed,” which feels out of step with a red market day. It suggests sentiment has not fully caught up with price action yet, or that earlier greed is now unwinding.
Daily chart: structure still favors bulls but momentum fades
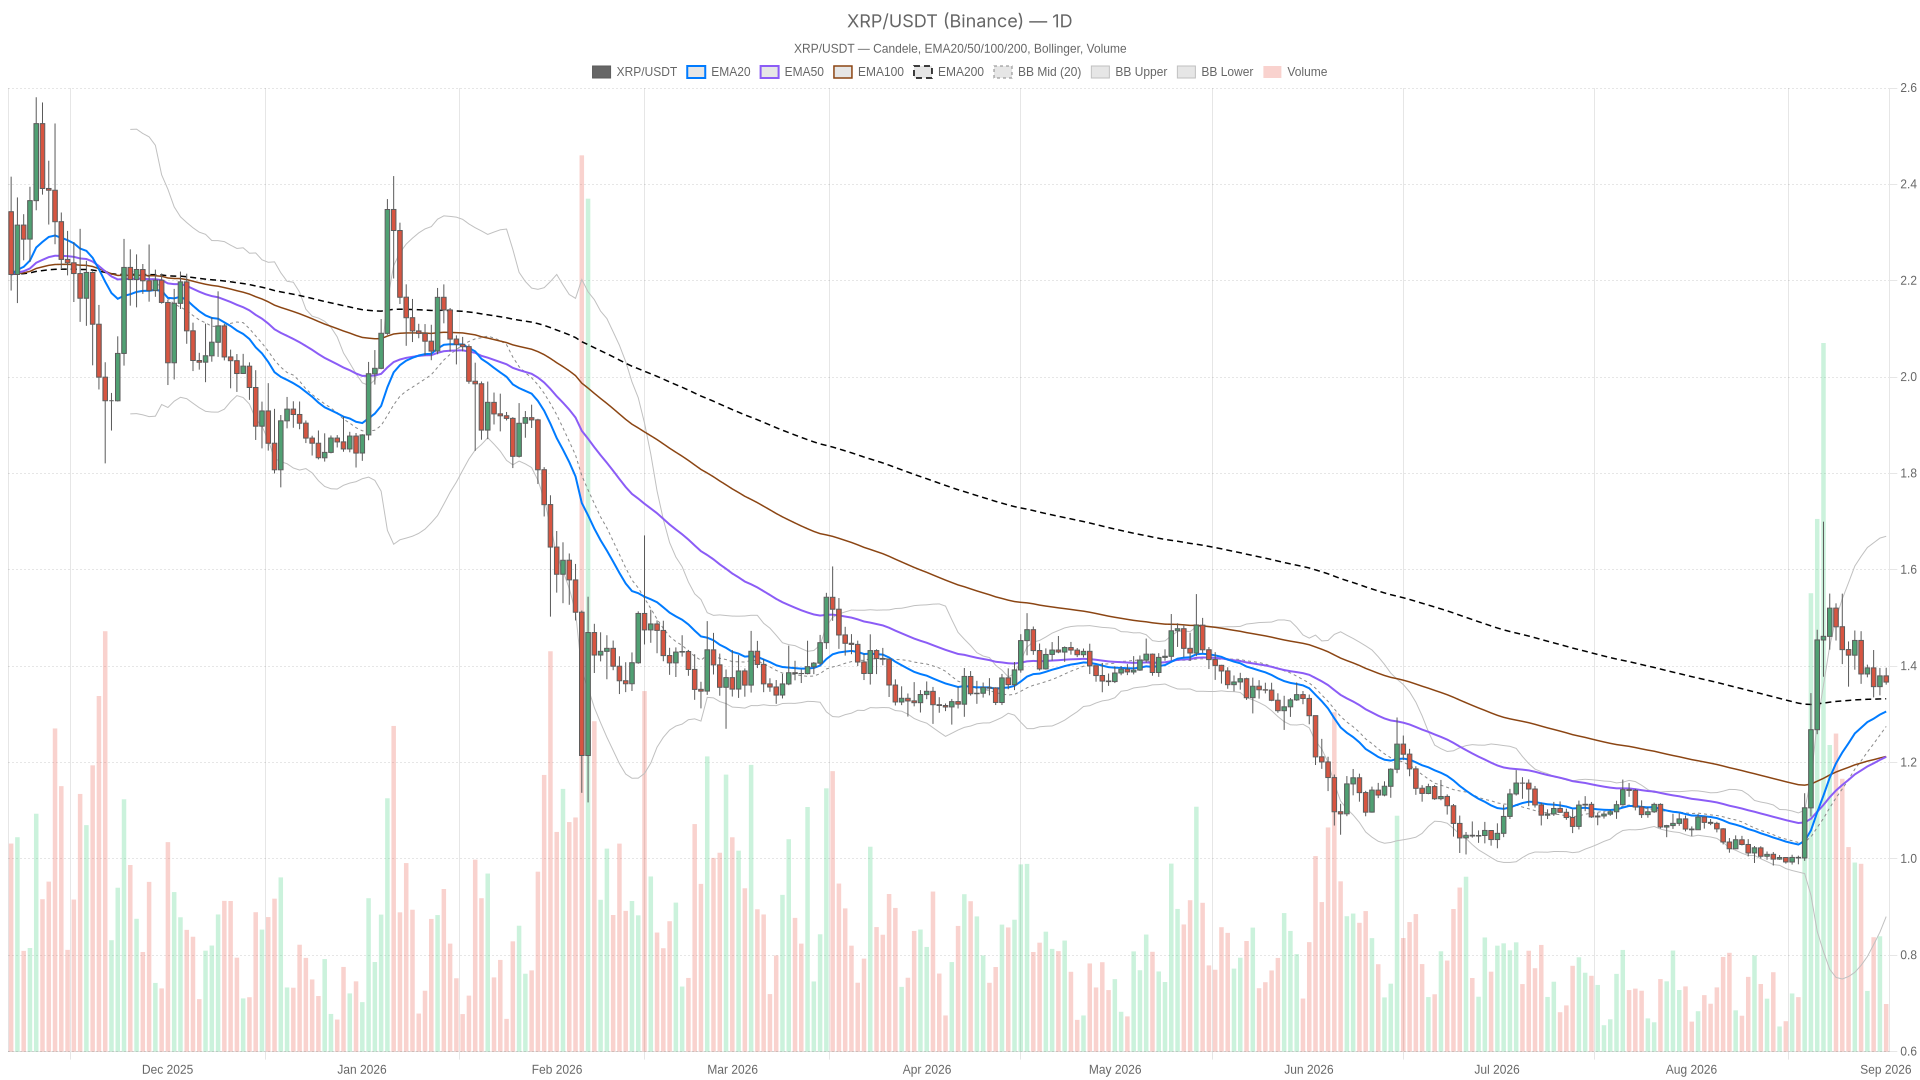
$XRP’s daily structure remains bullish with price above all three major EMAs, though momentum indicators are beginning to stall. The trend is intact but showing early signs of fatigue that warrant close attention.
On the daily timeframe, $XRP’s close at $1.37 sits above the 20-period EMA at $1.31, the 50-period at $1.21, and the 200-period at $1.33. That alignment is generally bullish: price above all three major trend lines. What stands out, however, is the internal ordering — the EMA50 sits well beneath both the EMA20 and EMA200. This pattern typically appears after a sharp rally outpaces the medium-term average. It is a bullish footprint, but not a mature one.
RSI on the daily chart sits at 60.69, comfortably above the midline but far from overbought territory. That leaves room to run higher without immediately signaling exhaustion. The MACD, however, paints a more cautious picture. The MACD line at 0.08 now sits just below the signal line at 0.09, with the histogram flattening to zero. That quiet momentum stall often precedes either a pause or a rollover — it does not confirm weakness, but it stops confirming strength.
The daily Bollinger Bands frame the picture in volatility terms: mid-band at $1.27, upper band at $1.67, lower band at $0.88. Price at $1.37 sits in the upper half but far from stretched. There is technical room toward the upper band before $XRP looks genuinely overbought. Daily ATR of $0.13 — nearly 9-10% of the current price — confirms this is not a low-volatility asset. Pivot levels reinforce the sense of a market at a decision point: the pivot sits at $1.38, resistance at $1.39, and support at $1.35. $XRP is essentially glued to its own pivot, which often precedes a directional move rather than a resting state.
Intraday picture: hourly and 15-minute charts diverge from the daily story
The hourly and 15-minute charts paint a decisively bearish short-term picture, with $XRP trading below its intraday EMAs and RSI readings below neutral. Sellers currently hold the near-term advantage, though compressed volatility suggests the pullback remains contained for now.
On the hourly chart, the regime flips to bearish. Price at $1.37 sits just below a tightly bunched EMA cluster: the 20-period at $1.38, 50-period at $1.38, and 200-period at $1.39. RSI reads 43.22, below the neutral 50 mark, confirming that short-term upward push has faded. The MACD is flat at zero, offering no real directional signal — momentum has gone quiet rather than turned decisively negative. Bollinger Bands are tight, with a low of $1.36, mid at $1.38, and high at $1.40. ATR of just $0.01 confirms intraday volatility has compressed sharply relative to the daily range.
The 15-minute chart reinforces the same bearish theme. RSI drops to 38.42, and the EMA stack shows the 20-period at $1.37 now below both the 50-period and 200-period at $1.38. That is the textbook sign of sellers nudging price lower within the range. MACD remains flat, and Bollinger Bands and ATR mirror the hourly readings almost exactly. This is execution-level noise rather than a structural break, but it is consistent noise — and consistency matters.
Bullish and bearish paths: what could move $XRP next
$XRP’s next direction hinges on whether bulls can defend the $1.33 EMA200 and reclaim the $1.38 pivot, or whether persistent intraday weakness drags price toward the $1.31 daily EMA20. Both scenarios carry credible technical backing right now.
The bullish case rests on the daily structure holding firm. If $XRP defends the $1.33 EMA200 and reclaims the daily pivot at $1.38, pushing through resistance at $1.39, that would resolve the current tension in favor of buyers. A recovery in hourly RSI above 50 and a flip of the hourly EMA cluster from resistance back to support would add confirmation. In that scenario, the daily Bollinger Band structure leaves room for a move toward the $1.67 upper band over time, though that is a longer-horizon reference point rather than an immediate target.
The bearish case, however, draws directly from what the intraday charts already show. If the hourly and 15-minute weakness persists and drags price through daily support at $1.35, the next real test becomes the daily EMA20 at $1.31. Below that sits the EMA50 at $1.21. A daily close beneath the $1.33 EMA200 would be the clearest signal that the bullish daily structure has actually broken. Until that line is breached on a daily close, this reads more as a cooling-off period than a reversal.
The tension between timeframes, however, is worth sitting with rather than resolving prematurely. The daily chart says $XRP is still structurally above its major averages, with room on RSI and Bollinger Bands to extend higher. The hourly and 15-minute charts say short-term sellers are in control, with momentum readings below neutral and price pinned under intraday averages. Both can be true at once — a healthy uptrend cooling off intraday is normal. A break of the daily EMA200 would not be.
Positioning and risk outlook
$XRP remains a high-volatility asset at a genuine inflection point, and the broader market’s risk-off tilt adds pressure that altcoins typically feel first and hardest. The daily ATR alone confirms that swings of several percentage points in a single session remain the norm.
For anyone tracking Ripple price today, the honest takeaway is that the asset sits at a genuine inflection point rather than a clean trend. The daily chart has not broken, but it is stalling. The intraday chart has not reversed the bigger trend, but it is actively fighting it. Whichever side wins that argument — bulls defending the EMA200 and pivot structure, or sellers pushing through toward the lower daily EMAs — will likely set the tone for where $XRP heads next. That outcome is genuinely open in either direction right now.
The broader market backdrop, moreover, reinforces the uncertainty. A nearly 3% drop in total crypto market cap alongside rising Bitcoin dominance suggests this is not purely an $XRP story, but part of a wider risk-off tilt. The Fear & Greed reading of 69 alongside a red market day reminds us that sentiment gauges can lag price, and greed can unwind quickly once price stops cooperating.
FAQ
What is $XRP’s price on September 1, 2026?
$XRP trades at $1.37 as of September 1, 2026, positioned above its daily EMA20 at $1.31, EMA50 at $1.21, and EMA200 at $1.33.
Is $XRP’s daily trend bullish or bearish?
The daily trend remains structurally bullish with price above all major EMAs and RSI at 60.69, though the MACD shows momentum stalling as the histogram flattens to zero.
What are the key support levels for $XRP right now?
Key support sits at $1.35 (daily S1), followed by the EMA200 at $1.33, the EMA20 at $1.31, and the EMA50 at $1.21. A daily close below $1.33 would signal a structural break rather than a normal pullback.
What is driving the intraday weakness in $XRP?
Intraday weakness reflects a broader market risk-off tilt, with total crypto market cap down 2.95% and Bitcoin dominance rising to 59.59%. On the hourly chart, RSI at 43.22 and price below the EMA cluster confirm sellers hold the short-term advantage.
Disclaimer: This article is for informational purposes only and does not constitute financial advice, an investment recommendation, or a solicitation to buy or sell any financial instrument or cryptocurrency. The analysis provided is not indicative of future results. Investing in crypto assets and financial markets carries a high risk of capital loss. Always do your own research (DYOR) and consult a qualified financial advisor before making any decision.
Article produced with the assistance of artificial intelligence and reviewed by the editorial team.