
 en.cryptonomist.ch
The crypto market is flashing mixed signals as of September 1, 2026, and the Dogecoin price today reflects that uncertainty, pinned near $0.08 on the daily chart. While the daily structure reads neutral, a closer look reveals bearish pressure building on shorter timeframes.
Key takeaways
- $DOGE consolidates at $0.08 with a neutral daily regime but trades below the 200-period EMA at $0.09
- RSI declines across timeframes: 53.91 daily, 41.32 hourly, and 38.31 on the 15-minute chart
- MACD is flat on all three timeframes — momentum has effectively gone quiet
- Total crypto market capitalization dropped 2.98% in 24 hours, while Bitcoin dominance climbed to 59.57%
- Daily Bollinger Bands span $0.06 to $0.10, with ATR at $0.01
What the Daily and Intraday Charts Are Saying
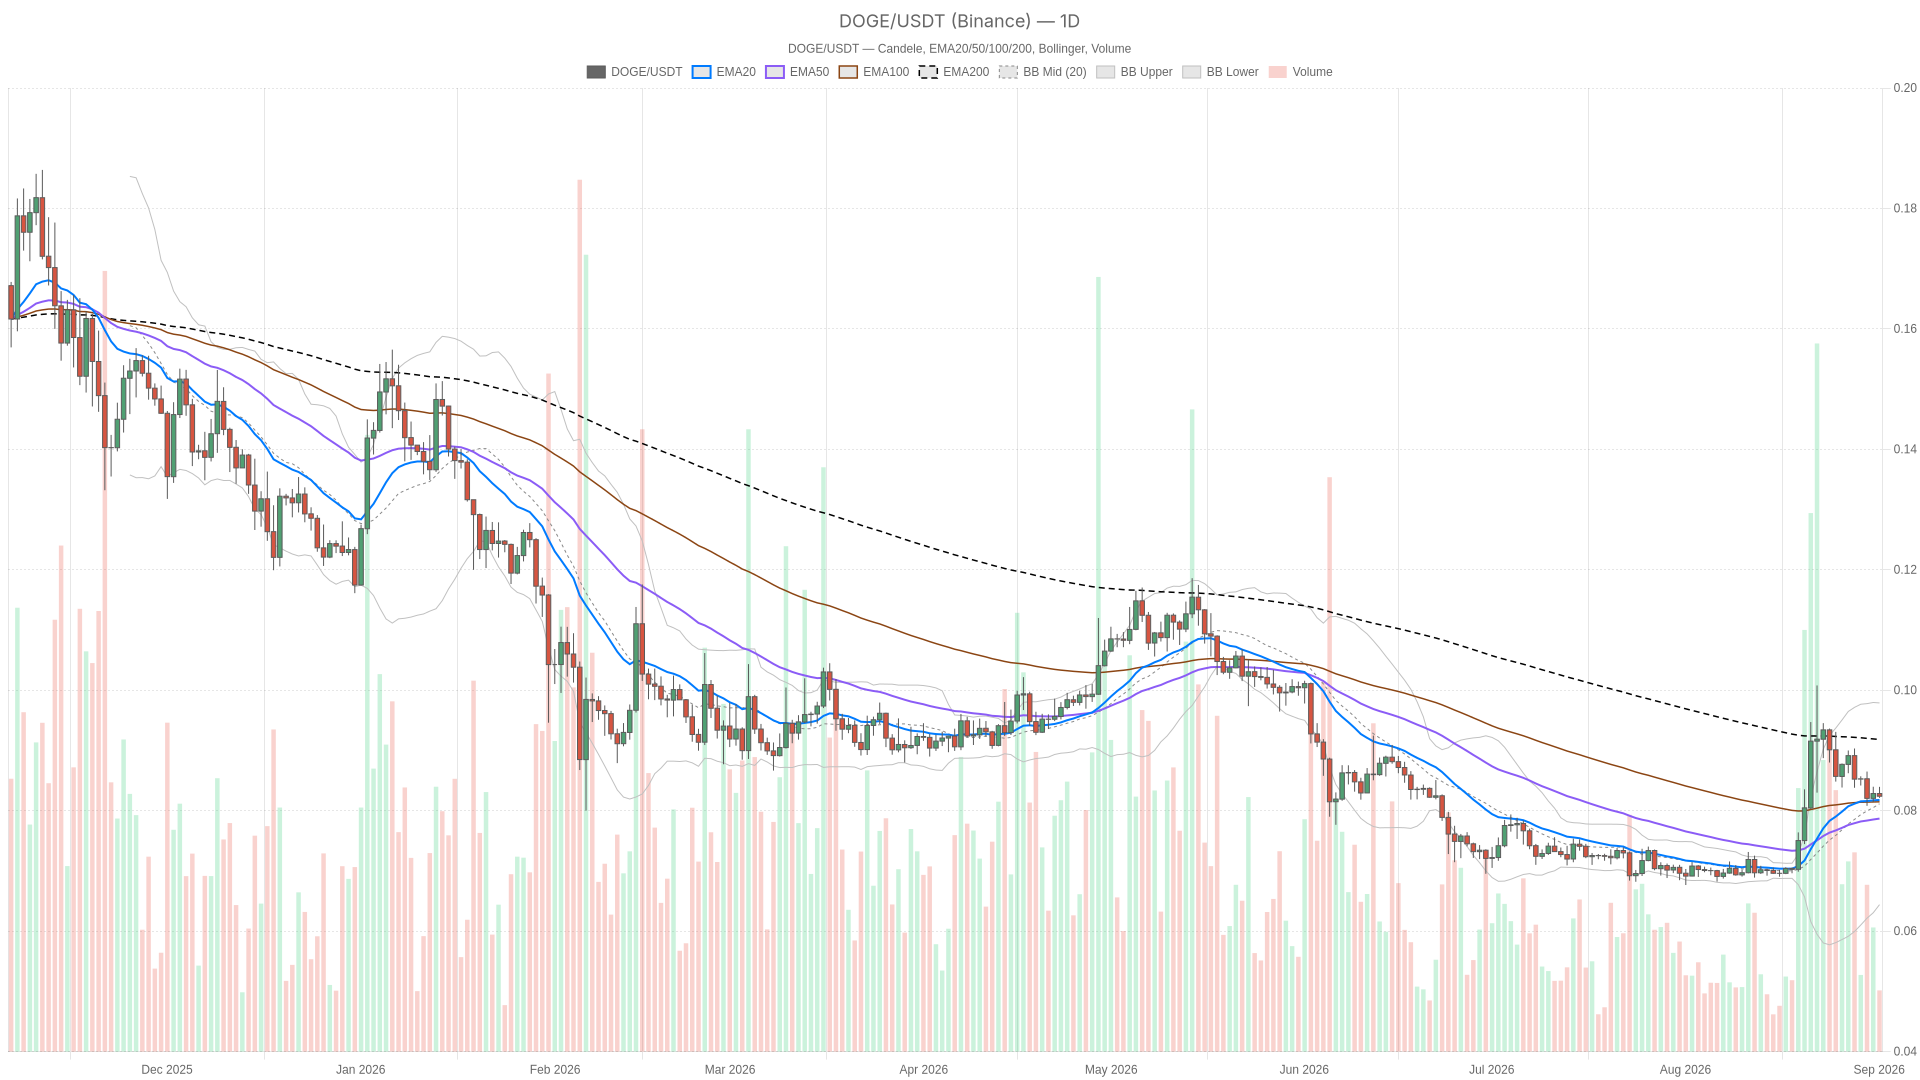
On the daily chart, $DOGE is trading right at its 20 and 50-period EMAs, both sitting at $0.08, but underneath the 200-period EMA at $0.09. That detail matters: price is consolidating below its longer-term average, which keeps the macro bias tilted soft even though the daily regime reading itself is labeled neutral. Until $DOGE reclaims that $0.09 level on a closing basis, the bigger picture stays undecided rather than genuinely bullish.
The 1-hour chart adds weight to the cautious read. Its regime is flagged bearish, with RSI at 41.32 — below the midline and trending down. Moreover, the 15-minute timeframe pushes that further, with RSI at 38.31 and its own regime also marked bearish. Line them up and you get a fading sequence: daily RSI at 53.91, hourly at 41.32, 15-minute at 38.31. That downward staircase across timeframes is often the first sign that intraday sellers are gradually gaining control even while the daily has not confirmed a breakdown yet.
Flat MACD and Mid-Range RSI
MACD is essentially flat across all three timeframes — line, signal, and histogram all reading zero. There is no crossover, no divergence, nothing pushing this market decisively in either direction. Momentum has gone quiet. That absence of a signal is itself informative: it tells you $DOGE is not trending hard right now; it is coiling. However, the RSI story is the more useful tell here — a daily reading in the low-50s paired with weaker hourly and 15-minute numbers suggests the coiling is happening with a slight downward lean rather than a balanced one.
Bollinger Bands, ATR and Pivot Compression
The daily Bollinger Bands have the mid-line at $0.08, the upper band at $0.10, and the lower band at $0.06 — a reasonably wide range that leaves room to move without technically breaking structure. Daily ATR sits at $0.01, which on an $0.08 token is not a trivial slice of price; it implies the daily candle range has real room to swing even in a neutral regime.
Contrast that with the hourly and 15-minute Bollinger Bands, where the mid, upper, and lower bands are all compressed to $0.08 and ATR reads at zero. That is a textbook volatility squeeze on the shorter timeframes — the market is holding its breath intraday while the daily chart still carries some breathing room. Meanwhile, pivot levels on the daily add to the compressed picture: the pivot point, R1, and S1 all cluster around $0.08, meaning price is sitting essentially on top of its own pivot with no meaningful separation between support and resistance. That is not a level structure giving traders a clear edge right now — it is a market waiting for a catalyst.
Bullish and Bearish Scenarios
The bullish case needs $DOGE to close back above the $0.09 EMA200 on the daily, with RSI pushing convincingly past the mid-50s and MACD flipping positive to confirm actual momentum behind the move. For that to have teeth, the hourly and 15-minute regimes would need to flip out of bearish territory too — otherwise it is just a daily wick that gets sold into. A move toward the upper Bollinger Band at $0.10 would be the marker that bulls have genuinely taken control. This scenario is invalidated if price fails to hold above $0.08 support and RSI on the lower timeframes keeps sliding rather than recovering above 50.
The bearish case is more straightforward given the current alignment. A daily close below the $0.06 lower Bollinger Band, confirmed by the hourly and 15-minute regimes staying bearish and RSI continuing to grind lower, would open the door to a deeper correction. This is especially relevant with total market cap already down 2.98% and dominance rotating toward Bitcoin, which according to CoinGecko data now sits at 59.57%. Tracking the Dogecoin price today means watching whether that bearish thesis gains traction or gets invalidated — which happens the moment $DOGE reclaims the $0.08 pivot with conviction and RSI on the shorter timeframes climbs back above 50.
Positioning and Risk Context
There is a genuine disconnect worth flagging: the Fear & Greed Index reads 69, classified as Greed, even as the broader market cap fell nearly 3% in a day and $DOGE’s own shorter-term regimes lean bearish. That mismatch usually means sentiment has not caught up with price action yet, or that greed is concentrated in assets outside the altcoin space — likely Bitcoin, given its rising dominance share. Either way, it is a reminder that headline sentiment gauges and asset-specific technicals can tell different stories at the same time.
For anyone tracking this market, the honest takeaway is that $DOGE is in a holding pattern with compressed short-term volatility sitting inside a daily range that still has room to swing. That combination — quiet momentum, tight intraday bands, and a lagging sentiment reading — tends to precede a volatility expansion rather than more of the same drift. Nobody can say with certainty which direction that expansion breaks, and given the flat MACD and directionless pivot structure, this looks like a moment to watch levels rather than force a conviction call.
FAQ
Is Dogecoin in a bearish or bullish trend right now?
The daily chart is neutral, but the 1-hour and 15-minute timeframes are both flagged bearish. RSI declines from 53.91 on the daily to 41.32 on the hourly and 38.31 on the 15-minute, suggesting intraday sellers are gradually gaining control even though the daily has not confirmed a breakdown.
What key levels should traders watch?
The $0.09 level — the 200-period EMA on the daily — is the critical resistance bulls need to reclaim for any sustainable upside. On the downside, the $0.06 lower Bollinger Band marks the level that, if broken on a daily close, would confirm a deeper correction. The $0.08 pivot cluster serves as the immediate battleground between buyers and sellers.
Why is MACD flat and what does that signal?
MACD is reading zero across line, signal, and histogram on all three timeframes. This indicates momentum has gone quiet — $DOGE is coiling rather than trending in either direction. Such quiet periods often precede a volatility expansion, though the direction is not predetermined by the indicator itself.
Disclaimer: This article is for informational purposes only and does not constitute financial advice, an investment recommendation, or a solicitation to buy or sell any financial instrument or cryptocurrency. The analysis provided is not indicative of future results. Investing in crypto assets and financial markets carries a high risk of capital loss. Always do your own research (DYOR) and consult a qualified financial advisor before making any decision.
Article produced with the assistance of artificial intelligence and reviewed by the editorial team.