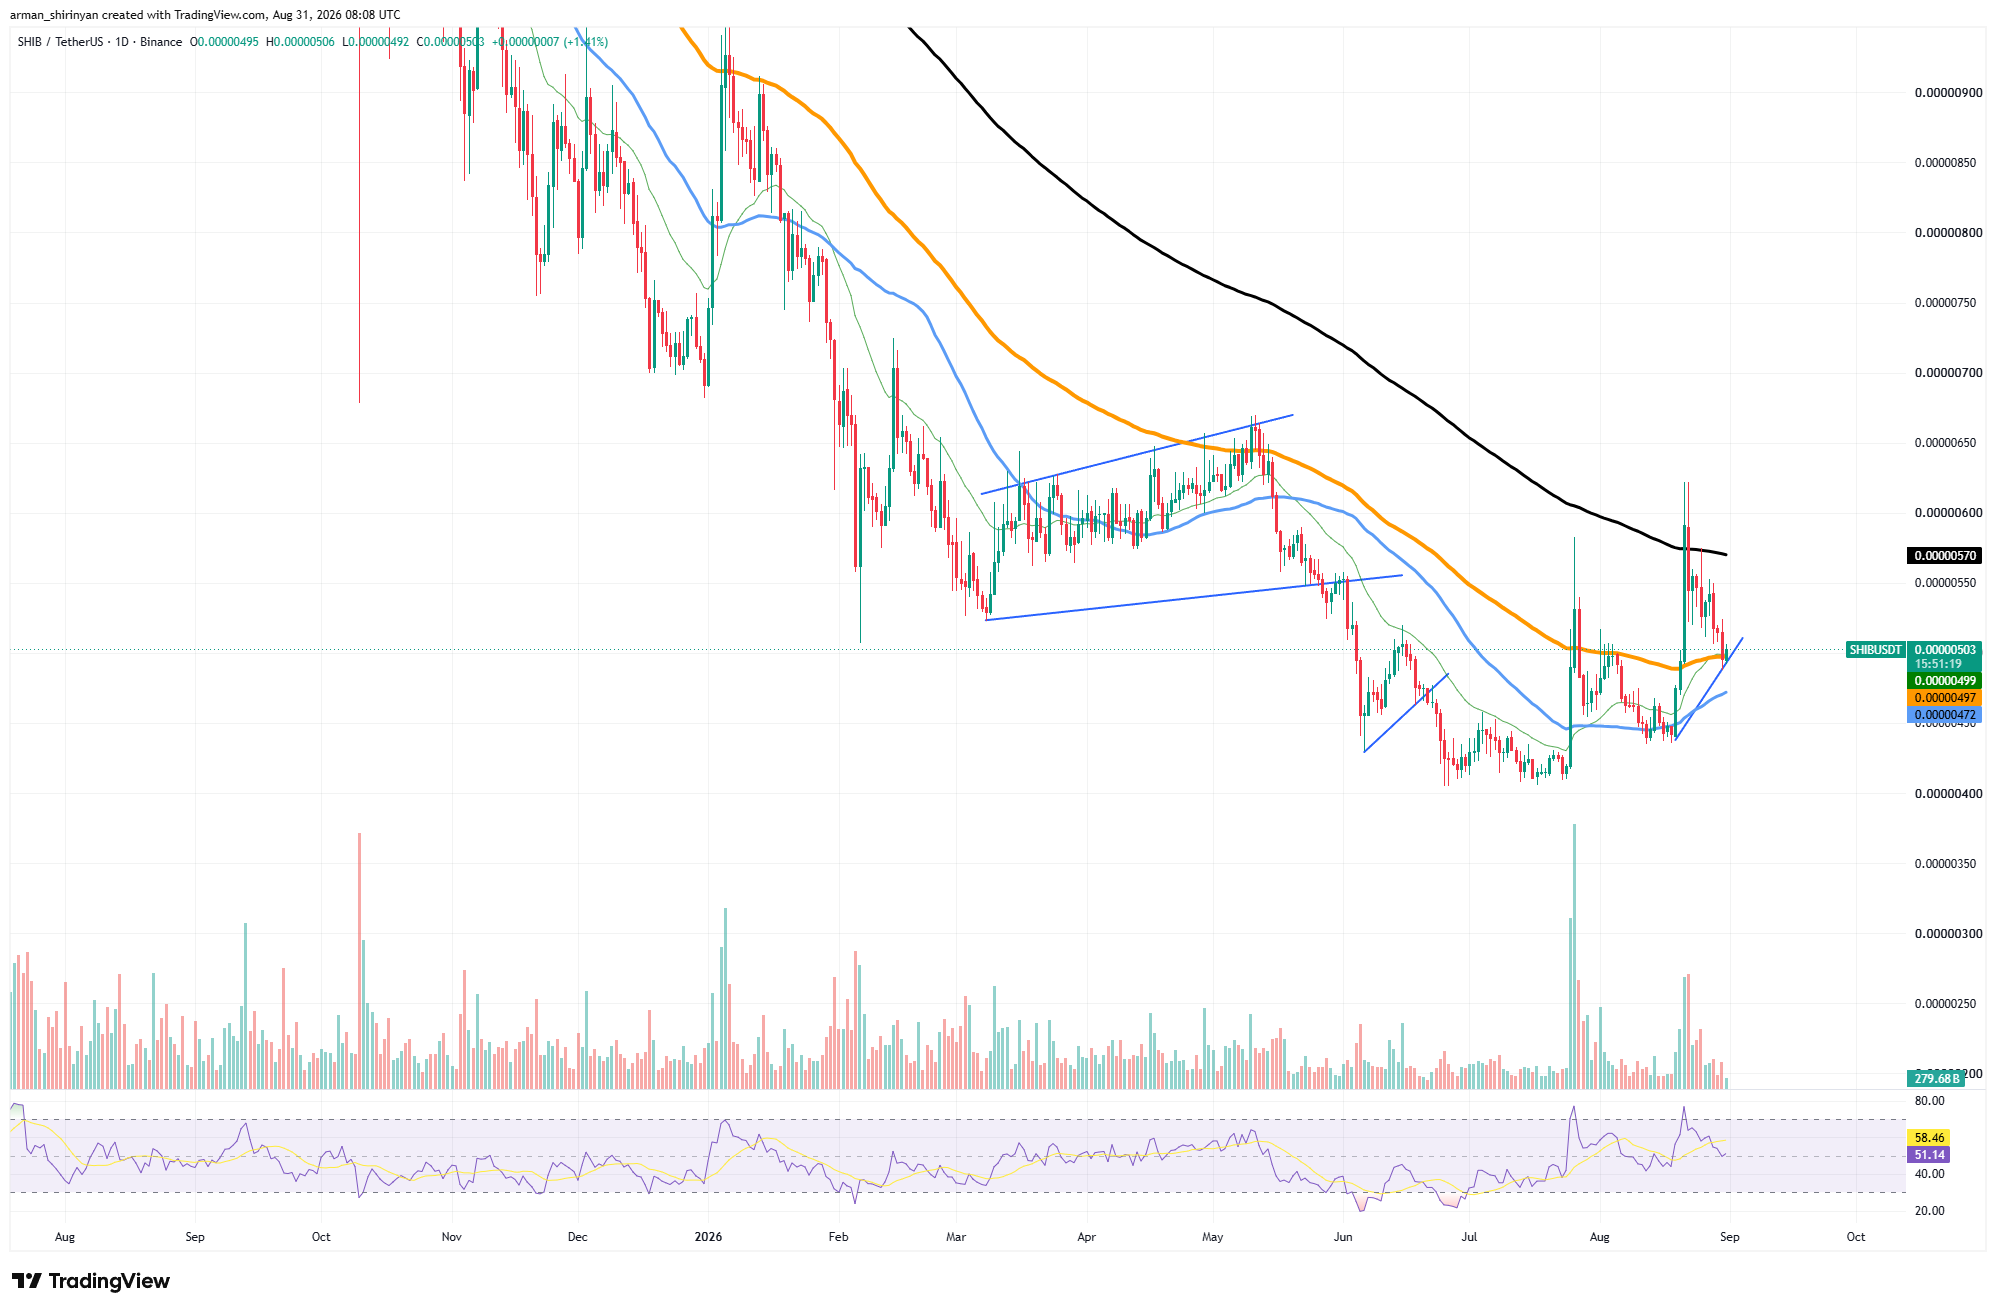
In the same zone, this produces both dynamic technical support and psychological support. $SHIB is already testing it. Therefore, a decisive daily close below $0.000005 would be more than a small correction. It would undermine most of the technical advancements made during the August recovery and put the token back below a significant medium-term trend indicator.
More support is located slightly below. In the event that $0.000005 fails, $SHIB has another possible defense thanks to the 50-day moving average's position around $0.00000472. The price would, however, return significantly closer to the prior consolidation range of $0.0000042–$0.0000045 if it fell toward that level.
Momentum dives down
Momentum isn't helping either. During the recent rally, the daily RSI briefly reached overbought territory before falling to about 51. This indicates that the previous bullish impulse has mostly subsided and places momentum almost exactly in neutral territory.
The situation on the upside is equally clear. In order to eventually regain the $0.0000055–$0.0000057 region, $SHIB must stabilize above $0.000005. The main long-term resistance is the 200-day moving average, which is still around $0.0000057 and rejected the most recent breakout attempt.
However, resistance is secondary at this time. The current battle is occurring at $0.000005. $SHIB may lose the foundation for its August recovery if the 100-day EMA and psychological support both fail at the same time. Holding the level would preserve another chance to test the 200-day average and ultimately create a more comprehensive bullish reversal.

 u.today