Zcash (ZEC) Charts a Head-and-Shoulders Setup With $600 on the Downside
thenewscrypto.com
27 August 2026 12:32, UTC
Zcash ($ZEC) has pushed the price to $792.
The sellers are temporarily controlling the price action.
As of August 27, Zcash ($ZEC) is showing a potential head-and-shoulders formation, with the price currently shaping the right shoulder around the $820-$830 area. Moreover, the neckline sits near $750, making that level critical for the token’s short-term direction.
On the other hand, $ZEC is trading around the $792.25 level, with $1.081 billion in 24-hour trading volume. Significantly, the asset has gained 40% over the past week and 68% over the past month, highlighting how sharply momentum has moved in recent weeks.
Know when your coins move
Alerts, real-time prices, and market news — all in one app
Point your phone camera to install
4.8 based on 40K reviews in the App Store and Google Play
$ZEC’s 24-hour range of $759.30-$817.85 shows that the price is testing the lower end of its recent trading pattern. A decisive break below the $750 neckline could confirm the bearish pattern and likely increase selling pressure, potentially exposing the $600 area as the next downside target.
For now, the Zcash market remains at a crossroads. Holding the neckline could allow buyers to stabilise the recent rally, while a breakdown would strengthen the bearish case and signal that momentum is shifting toward sellers.
Where Will Zcash Momentum Reach in the Near Term?
With the recent $ZEC/USDT trading pair having a brief bearish control, the price could fall to the support at around $781.37. If the downside correction intensifies, it might trigger the death cross to take place and send the asset’s price below the $770.29 range.
Upon a bullish reversal in the Zcash market, the price might climb and test the resistance at $803.76. Assuming extended upside pressure on the momentum, the bulls would gain more power, and the golden cross would emerge, gradually driving the price above $814.91.
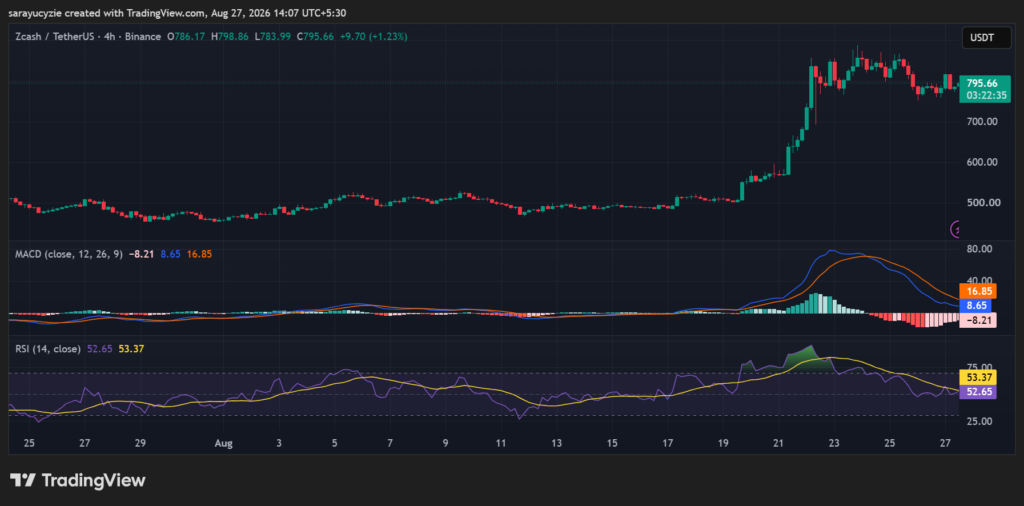
Zcash’s technical analysis shows that the MACD line has crossed below the signal line; the short-term buying power is slowing down relative to recent averages. The sellers are temporarily controlling the price action. Both lines are above the zero line, and the long-term trend remains firmly in buyer territory.
This is referred to as a dip in a bull market. If the MACD turns back and crosses above the signal line while still above zero. It gives a high-probability entry signal that the primary uptrend is resuming. If the MACD continues to fall and breaks below zero, the overall macro trend is shifting from bullish to bearish.
(Source: TradingView)
$ZEC’s daily RSI of 52.65 reflects a neutral market with a slight bullish bias, sitting above 50. The readings between 40 and 60 signify an equilibrium, showing no extreme overbought or oversold conditions. The positive momentum is outpacing selling pressure, but not enough to indicate a strong directional trend.
It is nowhere near overextended, with the price action having room to expand in either direction without immediate RSI-driven exhaustion. Price is moving sideways. A break above 60 puts buyers in firm control to start a momentum move up. A drop below 40 signals that bears are taking over control of immediate price action.

 thenewscrypto.com