
 en.cryptonomist.ch

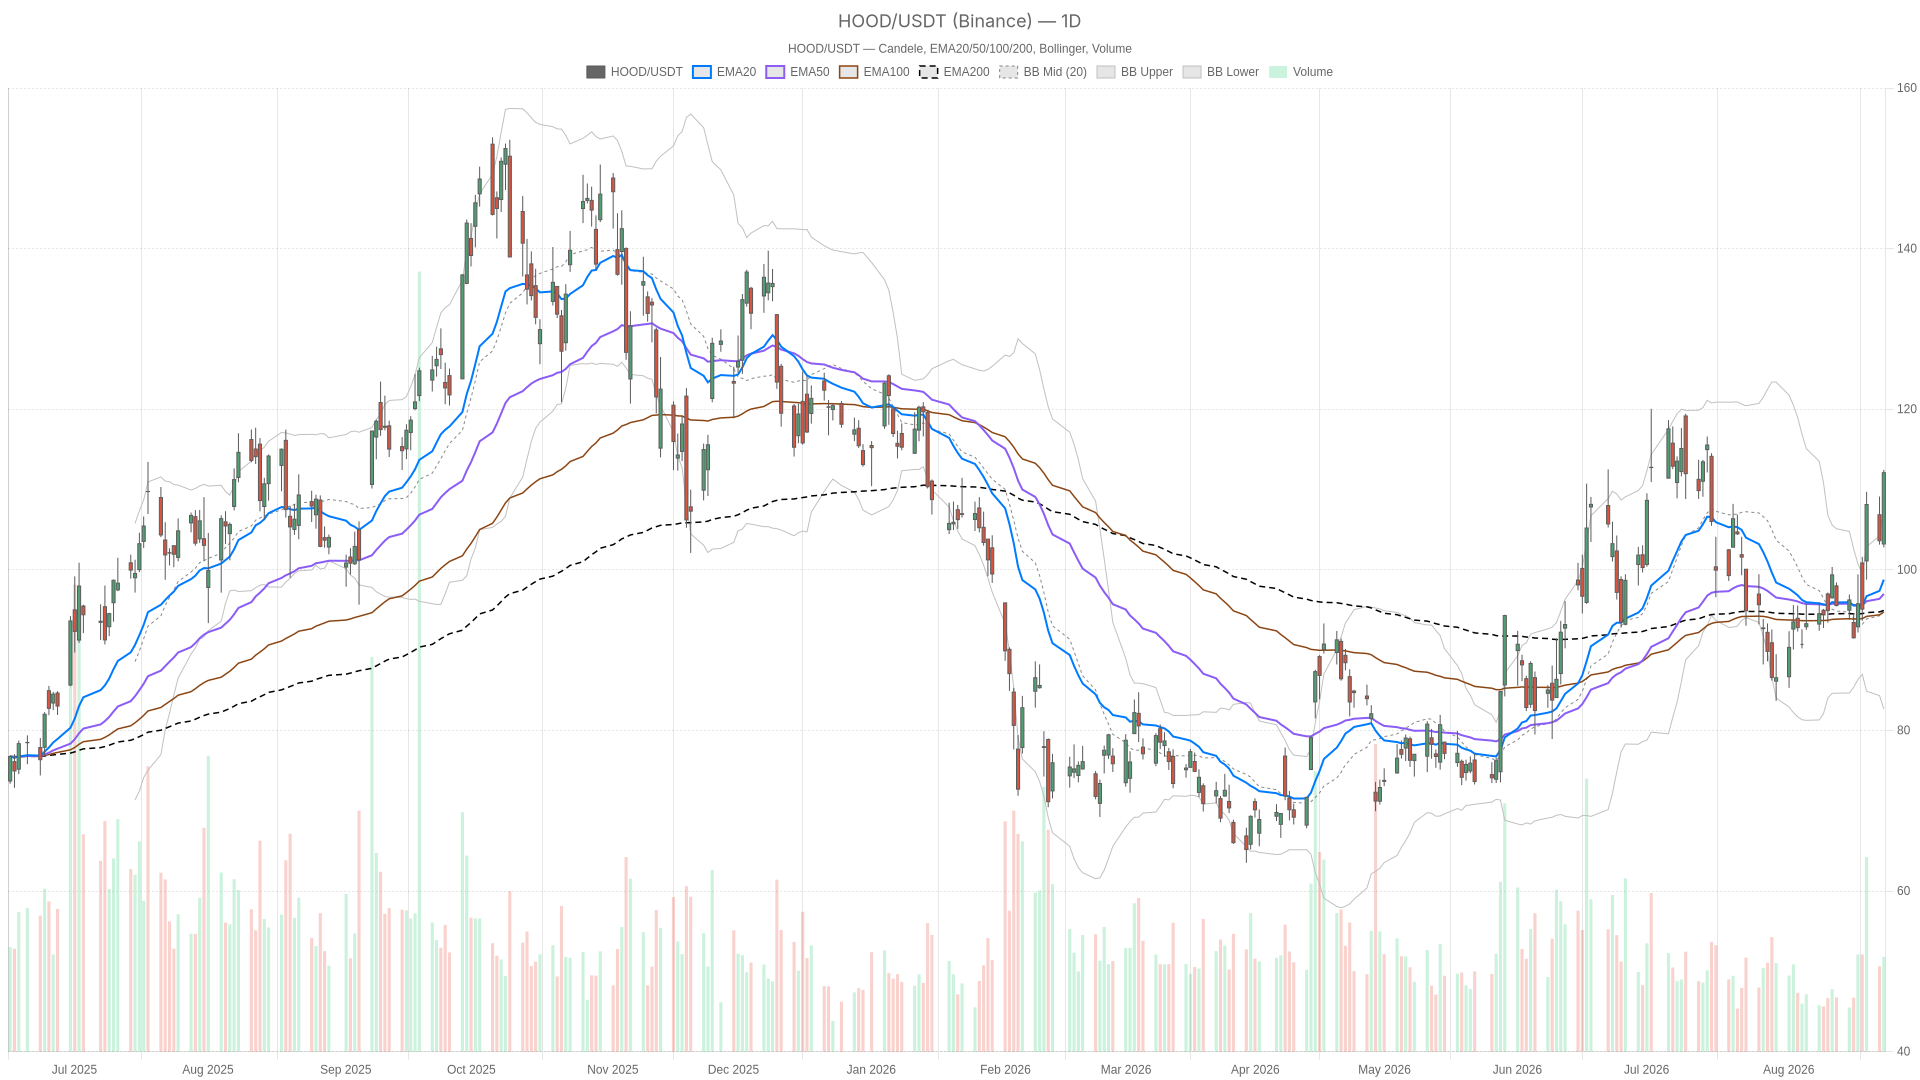
Robinhood stock just delivered one of its strongest sessions in months, closing at $112.09 after a 7–8% intraday surge. Shares pushed above every major daily moving average, driven by crypto strength, a day-trading rule repeal, and a Goldman Sachs buy-rating reiteration.
Key takeaways
- Robinhood stock closed at $112.09, up roughly 7–8% intraday and above every major daily moving average.
- Daily RSI14 at 63.52 and MACD histogram at 2.00 confirm bullish momentum without daily overbought extremes.
- Daily pivot resistance sits at 115.43, with support at 105.78 and the daily pivot at 109.11.
- Hourly MACD histogram narrowed to 0.18, signaling decelerating momentum despite the intact uptrend.
- Daily ATR14 at 5.77 reflects expanded volatility, supporting disciplined position sizing.
Robinhood Stock Daily Structure: A Clean Bullish Regime
Robinhood stock is in a clean bullish regime on the daily chart, with trend, momentum, and price structure aligned.
Momentum and Trend Alignment
The 20, 50, and 200-period EMAs sit at 98.78, 97.00, and 94.93 respectively. All three are stacked beneath price in textbook bullish order. RSI14 reads 63.52, firmly bullish but not yet overbought. That leaves breathing room before momentum exhaustion becomes a real concern.
Meanwhile, the MACD line at 1.67 sits well above its signal line at -0.34, producing a histogram of 2.00. This confirms that momentum, not just price, is backing the move.
Volatility and Breakout Levels
Volatility has also expanded meaningfully. ATR14 on the daily chart stands at 5.77, a sign daily ranges have widened considerably. Notably, Tuesday’s close of 112.09 landed above the upper Bollinger Band at 107.82, a classic breakout signature.
This kind of print often marks strength, but it also raises the odds of a short-term mean-reversion pause. The daily pivot sits at 109.11, with resistance at 115.43 and support at 105.78. These levels will likely define the next tactical battleground.
1H Timeframe: Confirmation With a Caveat
The hourly chart largely confirms the bullish bias for Robinhood stock, though short-term momentum is beginning to decelerate.
EMA20, EMA50, and EMA200 on the 1H chart are at 107.46, 102.79, and 98.79, again stacked bullishly beneath price. However, RSI14 has climbed to 68.19, edging closer to overbought territory than the daily reading suggests.
Meanwhile, the MACD histogram on the 1H has narrowed to just 0.18, down from a stronger separation earlier in the move. That narrowing is worth watching, since it hints hourly momentum is decelerating even as the broader trend remains intact.
Price on the 1H chart is also pressing against the upper Bollinger Band at 112.96, with hourly pivot resistance at just 112.44. In other words, the stock is trading right at the edge of its short-term volatility envelope. This does not invalidate the bullish daily thesis. Still, it suggests the rally is due for a consolidation phase or a brief pullback before the next leg.
15m Execution Context
The 15-minute chart turns slightly more cautious for short-term timing, though the broader structure remains intact.
Notably, the MACD histogram here is negative at -0.10, even though the MACD line at 1.01 remains above zero. RSI14 sits at 63.5, still constructive but softer than the hourly reading.
Price is hugging the middle-to-upper Bollinger range, with the 15m pivot at 111.96 and resistance at just 112.32. In turn, this tight band reflects the kind of consolidation typical after a sharp intraday spike. For traders focused on entries, this compression phase is the detail to monitor rather than the broader trend itself.
The Bullish Case for Robinhood Stock
The bullish case rests on continuation above the daily pivot resistance at 115.43. It also depends on sustained volume and the same catalysts that sparked the rally.
Goldman Sachs reiterating its buy rating on both Robinhood and Coinbase adds institutional weight behind the move. At the same time, retail trading activity has reportedly surged following the day-trading rule repeal. Meanwhile, CEO Vlad Tenev’s continued push into tokenization keeps the company’s long-term narrative in focus.
If daily RSI holds below overbought extremes while the MACD histogram stays positive, the path of least resistance remains higher.
The Bearish Risk and What Would Invalidate the Rally
The rally would be invalidated by a failure to hold above the daily pivot at 109.11. A slip back toward the daily EMA20 near 98.78 would have the same effect.
A daily MACD histogram rolling over from its current 2.00 reading, combined with hourly momentum already narrowing, would strengthen that case. Should price retreat toward the Bollinger mid-band on the daily chart near 95.24, it would signal the rally has lost its underlying force. Profit-taking would then be in control.
Closing Take on Robinhood Stock
The weight of evidence across daily and hourly timeframes still favors the bulls, but caution is warranted near extended levels.
Trend, momentum, and news flow are all aligned in the same direction. However, the narrowing MACD histogram on the 1H chart warrants some caution. The proximity to upper Bollinger Bands on both the daily and hourly frames adds to that caution.
Volatility, as measured by a daily ATR14 of 5.77, has expanded sharply. That alone argues for disciplined position sizing rather than chasing extended moves. Robinhood stock has proven it can rally hard on catalyst-driven days. Still, price is sitting well above its recent range. The next few sessions should clarify whether this is a sustained trend or a catalyst-fueled spike that needs time to digest.
FAQ
What drove the Robinhood stock breakout?
The surge followed renewed crypto strength, a day-trading rule repeal, and a Goldman Sachs buy-rating reiteration on Robinhood and Coinbase.
What are the key levels to watch in Robinhood stock?
Daily pivot resistance sits at 115.43, with support at 105.78 and the daily pivot at 109.11. A slip toward the daily EMA20 near 98.78 would weaken the bullish case.
Is the hourly chart still bullish?
Yes, but with a caveat. The hourly EMA20, EMA50, and EMA200 remain stacked bullishly beneath price, while the MACD histogram has narrowed to 0.18 and RSI14 sits at 68.19.
How high is volatility in Robinhood stock?
Daily ATR14 stands at 5.77, reflecting sharply expanded volatility and supporting disciplined position sizing over chasing extended moves.
Disclaimer: This article is for informational purposes only and does not constitute financial advice, an investment recommendation, or a solicitation to buy or sell any financial instrument or cryptocurrency. The analysis provided is not indicative of future results. Investing in crypto assets and financial markets carries a high risk of capital loss. Always do your own research (DYOR) and consult a qualified financial advisor before making any decision.
Article produced with the assistance of artificial intelligence and reviewed by the editorial team.