
 crypto.news

$XRP traded near $1.44 on Aug. 26, falling 5.36% over 24 hours as traders reduced exposure after one of the token’s strongest weekly rallies since 2024.
The $XRP price remained approximately 43.7% higher over seven days despite Wednesday’s decline. Its 24-hour range extended from $1.42 to $1.52, while trading volume reached approximately $3.89 billion.
$XRP price retreats after its 44% rally
$XRP advanced from approximately $1.00 on Aug. 18 to an intraday high near $1.69 on Aug. 22. The move briefly produced gains exceeding 50% before the token retreated toward $1.44.
The rally allowed $XRP to recover above the consolidation range that contained its price during early August. However, the token remains more than 60% below its July 2025 record of $3.65.
The broader advance followed improving conditions across the cryptocurrency market. Bitcoin moved toward $80,000 as falling U.S. Treasury yields and renewed exchange-traded fund demand brought buyers back to risk assets.
$XRP outperformed most large cryptocurrencies during that recovery. As previously reported, $XRP posted its strongest weekly advance since the SEC settlement rally after rising more than 50% from its August low.
Seven-month leverage high increases liquidation risk
$XRP’s estimated leverage ratio on Binance reached approximately 0.21, its highest reading since January, according to CryptoQuant data.
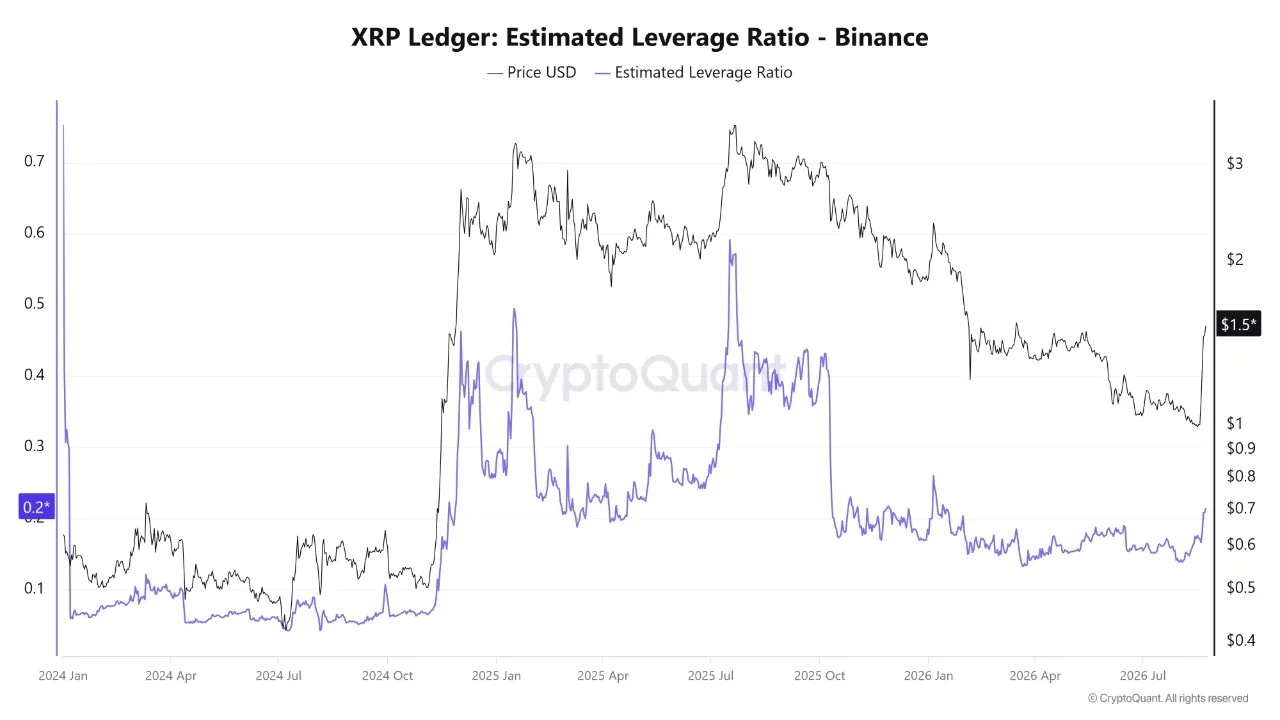
The ratio compares futures open interest with the amount of $XRP held in Binance reserves. A higher reading means leveraged derivatives exposure has increased relative to immediately available exchange supply.
CoinGlass figures showed $XRP futures open interest near $3.45 billion. Futures trading volume reached about $6.4 billion over 24 hours, more than five times the reported $1.2 billion in spot activity.
Long positioning also dominated several exchanges. Binance recorded approximately two long accounts for every short account, while the ratio among its top traders approached three to one. OKX showed close to two longs for each short.
The leverage ratio does not guarantee a correction. However, heavily concentrated long exposure can amplify losses if $XRP breaks below nearby support and exchanges begin closing undercollateralized positions.
Forced liquidations involve exchanges selling positions when their remaining collateral falls below maintenance requirements. Several liquidations occurring together can accelerate an otherwise limited price decline.
ETF turnover does not equal new investment inflows
Trading in the Bitwise $XRP ETF exceeded $80 million during its strongest recent session after topping $60 million during each of the preceding two sessions, according to market data shared by Teddy Fusaro.
The fund’s official data showed approximately $494.1 million in net assets on Aug. 24 and 4.85 million shares traded. At the reported market price, that share activity produced turnover near $80 million.
Trading volume measures the value of fund shares changing hands. It does not show how much new capital entered the product. Creations, redemptions and net flow data are required to establish institutional accumulation.
U.S. spot $XRP ETFs recorded approximately $13.8 million in combined net inflows on Aug. 24, according to market tracking cited in coverage of cumulative $XRP ETF flows reaching $1.56 billion.
Onchain activity points to volatility, not only accumulation
BankXRP claimed that $XRP receiving addresses increased 698%, but the post did not identify its data provider, measurement period or methodology. The figure therefore cannot independently establish accumulation.
Separate data shared by analyst Ali Martinez showed active addresses rising 654.71%, from 47,180 to 356,070. Active addresses include wallets sending or receiving transactions and are not identical to new receiving addresses.
Higher address activity can reflect transfers between exchanges, automated wallet operations, payments or speculative trading. It does not prove that investors are accumulating and holding $XRP.
The activity still confirms a sharp increase in network participation. Such spikes often accompany stronger volatility, which is consistent with $XRP’s rapid advance and subsequent pullback.
$XRP indicators remain bullish but stretched
On the supplied daily chart, $XRP’s relative strength index reached 74.29, above the conventional overbought level of 70 and its moving average near 60.23.
The reading confirms strong momentum but suggests the rally has become extended. An overbought RSI does not require an immediate reversal, particularly during a strong trend.
The MACD remains bullish. Its main line stands at 0.1069, above the 0.0617 signal line, while the positive histogram expanded to 0.0453. These readings show that upward momentum remains present despite the daily decline.
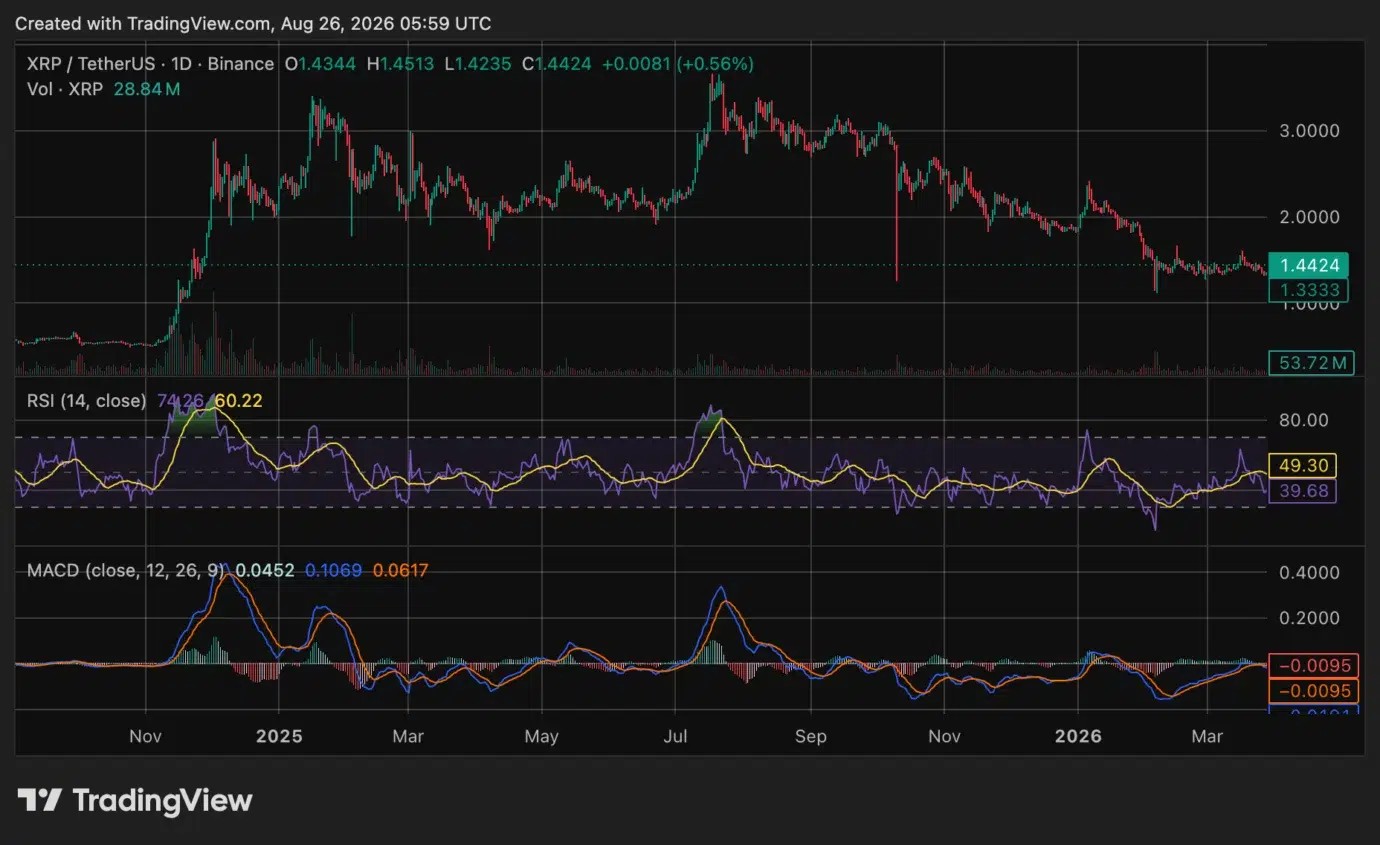
Immediate resistance lies between $1.45 and $1.50, followed by approximately $1.56. $XRP must reclaim that area to challenge the previous peak near $1.69.
Initial support sits at the 24-hour low near $1.42. A sustained break below it could expose $1.30 to $1.35, while the larger breakout zone remains between $1.00 and $1.10.