
 decrypt.co

In brief
- $XRP closed at $1.4554 on the latest daily candle, down from a $1.5505 high.
- The 50-day moving average sits below the 200-day, with a death cross still active.
- The medium-term structure says bearish, but $XRP isn't alone.
The crypto market flipped from fear to "extreme greed" this week for the first time since 2024, and the Ripple-linked $XRP rode that wave hard.
$XRP, the cryptocurrency created by the co-founders of Ripple, erased its most bearish signal last week and took off, registering a 46% gain over seven days and topping a $91 billion market cap.
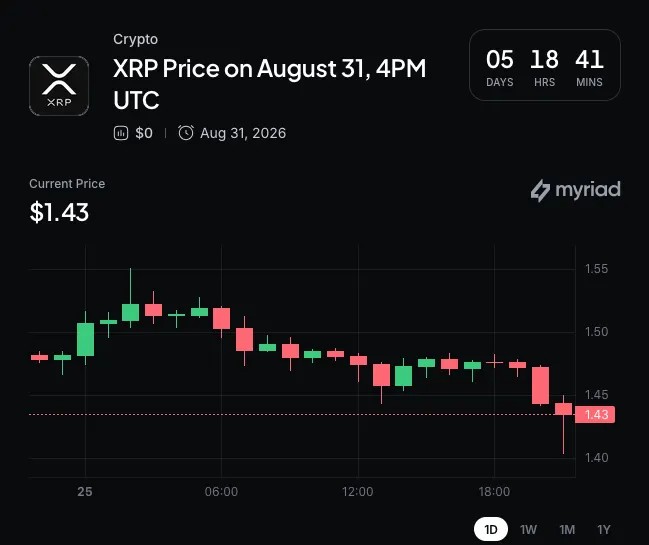
But, as is usually the case, what goes up must come down. And now $XRP’s hot streak is cooling, dropping as much as 2% earlier today.
$XRP isn't the only top-10 coin pulling back today, but among the decliners, $XRP's drop is one of the shallowest.
$XRP price: What the charts say
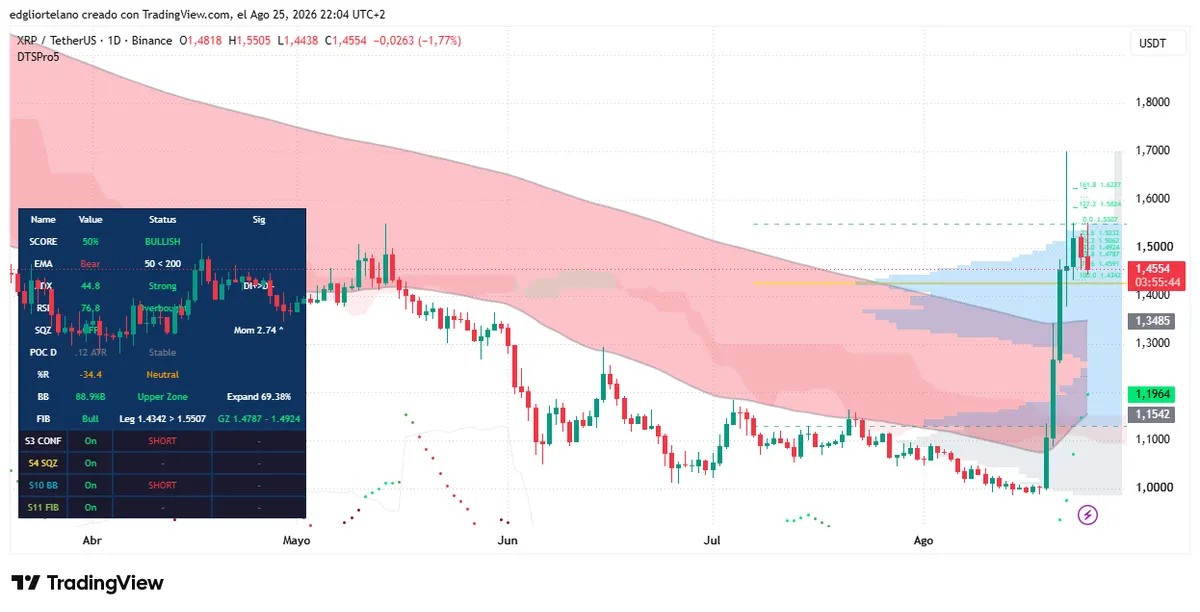
$XRP is trading at $1.4554 on the daily chart, down from a $1.5505 high, in a recovery that still hasn't escaped a longer-term downtrend.
For the better part of April through July, $XRP ground lower, bottoming near $1.00 in early August. Since then the move has been vertical—a roughly 55% rip to $1.55, with the Average Directional Index (an indicator that measures trend strength, regardless of direction) at 44.8 confirming this was no weak bounce but a strong directional leg.
But running too hot for too long can cause issues, and this leg ran straight to $1.55, then reversed. The latest daily candle closed at $1.4554 after opening at $1.4818, the second straight down day. This has the shape of a relief rally stalling under resistance, not a trend reversal.
The average price of the last 50 days (also known as EMA50) for $XRP is below the 200-day average in the formation traders call a death cross. When the shorter average sits below the longer one, the medium-term trajectory is still pointed downward, suggesting bearish times still ahead for the coin.
A death cross is a lagging signal—the sharp August rally lifted $XRP well above both lines before this pullback, which is why the recent strength didn't instantly flip the stack.
But with the death cross still on, $XRP’s bounce risks resolving into a bull trap if the market rejects $1.55 again.
The Relative Strength Index, or RSI, reads 76.8. RSI is a momentum gauge on a 0–100 scale: above 70 is overbought, below 30 is oversold. At 76.8, $XRP is stretched to the upside, a warning that the recovery ran hot rather than a green light.
The best argument for a bull scenario happens If $XRP reclaims and holds $1.5507, then drives toward $1.5824 and $1.6227. That needs what traders call the squeeze momentum to fire and RSI to cool without the price breaking down.
Bear case: $XRP loses the $1.4342 floor and the recovery slips back toward the early-August base. A daily close under $1.4342 puts the $1.40 shelf and the $1.00 origin of the rally back in play.
Until $XRP reclaims $1.5507, the base case is lower, a drift toward $1.4342 before the squeeze decides the next leg.
Disclaimer
The views and opinions expressed by the author are for informational purposes only and do not constitute financial, investment, or other advice.