
 ambcrypto.com

The Solana [$SOL] token surged 7% in the last 24 hours, extending its weekly gains to 32%. This was after breaking the critical two-month resistance zone between $78 and $79. This resulted in the clearest structural recovery since June.
As soon as the price was above $79, $SOL climbed to $88 and went all the way to $103.50. At that point, sellers rejected that high, forcing the price to retrace toward $87 while testing whether buyers would defend the breakout.
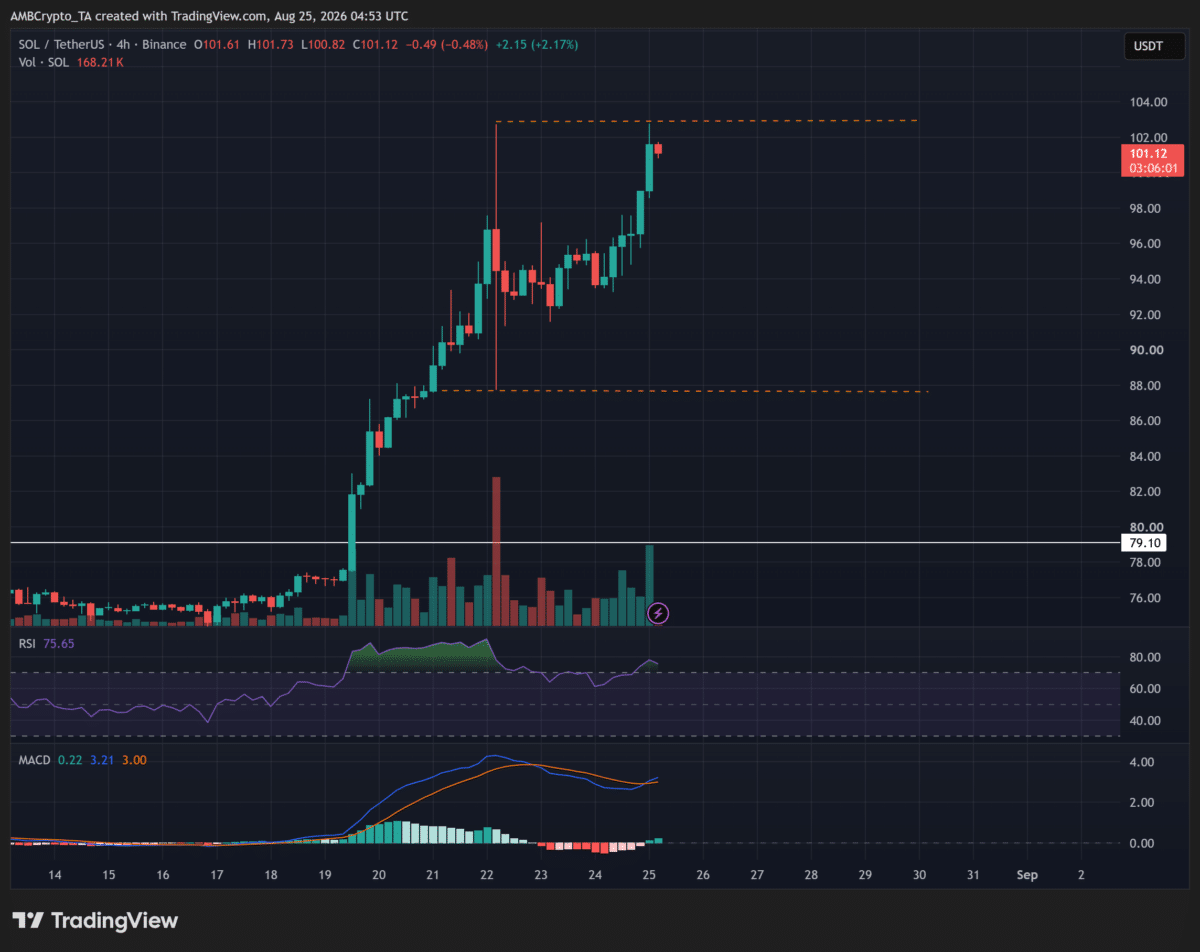
However, buyers defended their breakout area and instead recovered at prices above $92 and below $97. Rather than retracing completely to the launchpad at $79, $SOL formed a base between $92 and $97 as sellers lost momentum.
Later on, buyers regained momentum, pushing the price above $100 and back to $101.12, bringing the $103.50 ceiling into play again.
If $SOL prints a close on a four-hour chart above $103.50, it will be clear that all supply is out of the way, continuing upward momentum and testing $115.
On the other hand, another failure at $103.50 will send attention back to the $92-$97 area. A failure below that will make $87 a focal point.
BSOL trading volume hits a record high
As $SOL approached the resistance point, the trading volume of Bitwise’s Solana Staking ETF rose higher than it has been recently. BSOL had a total trading volume of $108.65 million, which is also the largest single day that this Solana-based ETF has seen to date.
The previous high for this ETF occurred at $60-$80 million per day, with average volumes typically ranging from $15 million to $40 million.
Even more impressive was the four-day trading volume of $261 million with an average of about $65 million per trading day.
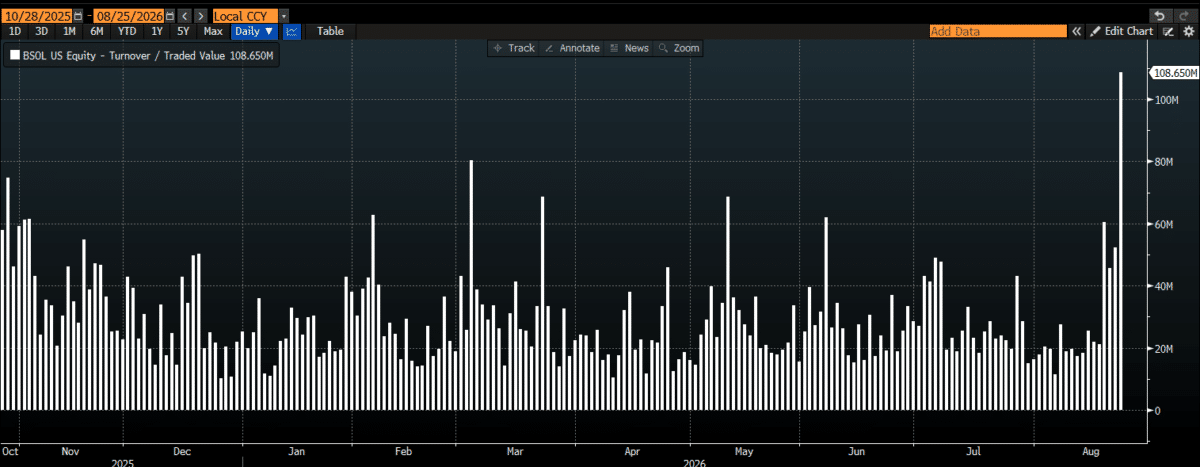
Needless to say, this implies that the activity surged prior to the price surge rather than it being entirely in one session. However, traded volume records shares exchanged between investors rather than fresh money entering BSOL or direct $SOL purchases.
All in all, the figures support stronger ETF liquidity. Yet, despite that milestone, netflow data remains essential to establish whether new capital flows supported the activity.
Mapping $SOL’s move above $100
Following the sharp impulse move, $SOL must now demonstrate structural retention above key support. At press time, $SOL sat at $101.98 below the $103.16–$103.50 resistance zone. This was the level where the earlier momentum met strong selling.
A 4-hour candle close above the breakout level of $103.50 will confirm the breakout to $106.80. The upside target is then followed by the Fibonacci levels at $110.88 and $112.70 before reaching the psychological barrier at $115.
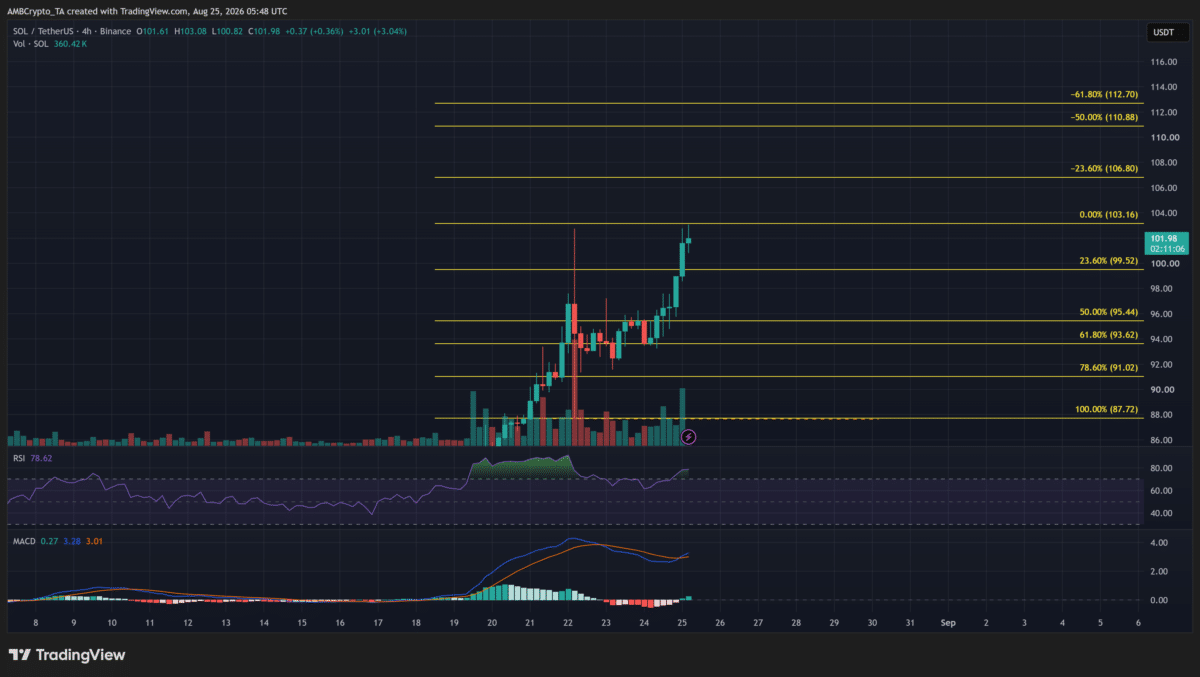
On the other hand, a low at $99.52 will be an early warning. This is because it represents the 23.6% retracement of the price movement from $87.72. If this low were to be broken, the support for $95.44 would be lost.
Losing that midpoint would return half the advance and invalidate short-term momentum, delaying any near-term move toward $115.
Final Summary
- Solana reclaimed $100 and is retesting the $103.50 resistance before its next leg up.
- BSOL recorded $108.65 million in daily volume, confirming its strongest trading activity on record.