
 invezz.com

Cardano is trading below $0.220 on Monday as traders take profits following last week’s sharp rally.
$ADA gained more than 24% during the previous week as the broader cryptocurrency market welcomed the US Treasury’s decision to double its debt buyback operations.
Such a large advance within a short period often encourages investors to lock in gains. Cardano could therefore enter a pause or consolidation phase before attempting another move higher.
Although the technical structure remains constructive, on-chain and derivatives data point to growing caution among traders.
Cardano whales sell 100 million $ADA
Santiment’s Supply Distribution data shows that large Cardano holders have started reducing their positions.
Wallets holding between 1 million and 10 million $ADA and those controlling between 10 million and 100 million $ADA have collectively sold 100 million tokens since Saturday.
The distribution suggests that some whales are taking profits after Cardano’s strong weekly performance.
Continued selling by large holders could increase the supply available on the market and place additional pressure on $ADA’s price in the near term.
Cardano’s derivatives market also reflects a more cautious outlook. CoinGlass data shows $ADA’s long-to-short ratio at 0.86 on Monday, near its lowest level in more than a month.
A ratio below one indicates that short positions outnumber long positions, suggesting more traders expect Cardano’s price to decline.
The bearish positioning does not guarantee a correction, but it supports the possibility of consolidation as the market absorbs last week’s gains.
Cardano holds above key moving averages
$ADA trades below $0.220 while remaining above its 50-day and 100-day Exponential Moving Averages at $0.187 and $0.196.
Holding above these moving averages supports a bullish near-term structure. Cardano has also reclaimed the 50% Fibonacci retracement level near $0.213, which now serves as immediate support.
The Relative Strength Index stands near 60. This reading indicates strong buying momentum but also places $ADA close to overbought territory, raising the risk of a temporary pullback.
The Moving Average Convergence Divergence indicator remains above its signal line and in positive territory. Its expanding histogram also suggests that bullish pressure has not yet disappeared.
Cardano’s first significant resistance sits at the 61.8% Fibonacci retracement level of $0.231.
A breakout above that level would bring the horizontal resistance at $0.236 into focus, followed by $0.245.
The 200-day EMA at $0.249 represents the strongest barrier within this cluster. $ADA must record a sustained breakout above that level to confirm a broader recovery.
If buyers clear the $0.231 to $0.249 resistance zone, Cardano could extend its rally toward $0.299.
The recent breakout level near $0.213 provides Cardano’s first line of support.
A close below that area could expose the convergence of the 100-day EMA at $0.196 and the 38.2% Fibonacci retracement near $0.195.
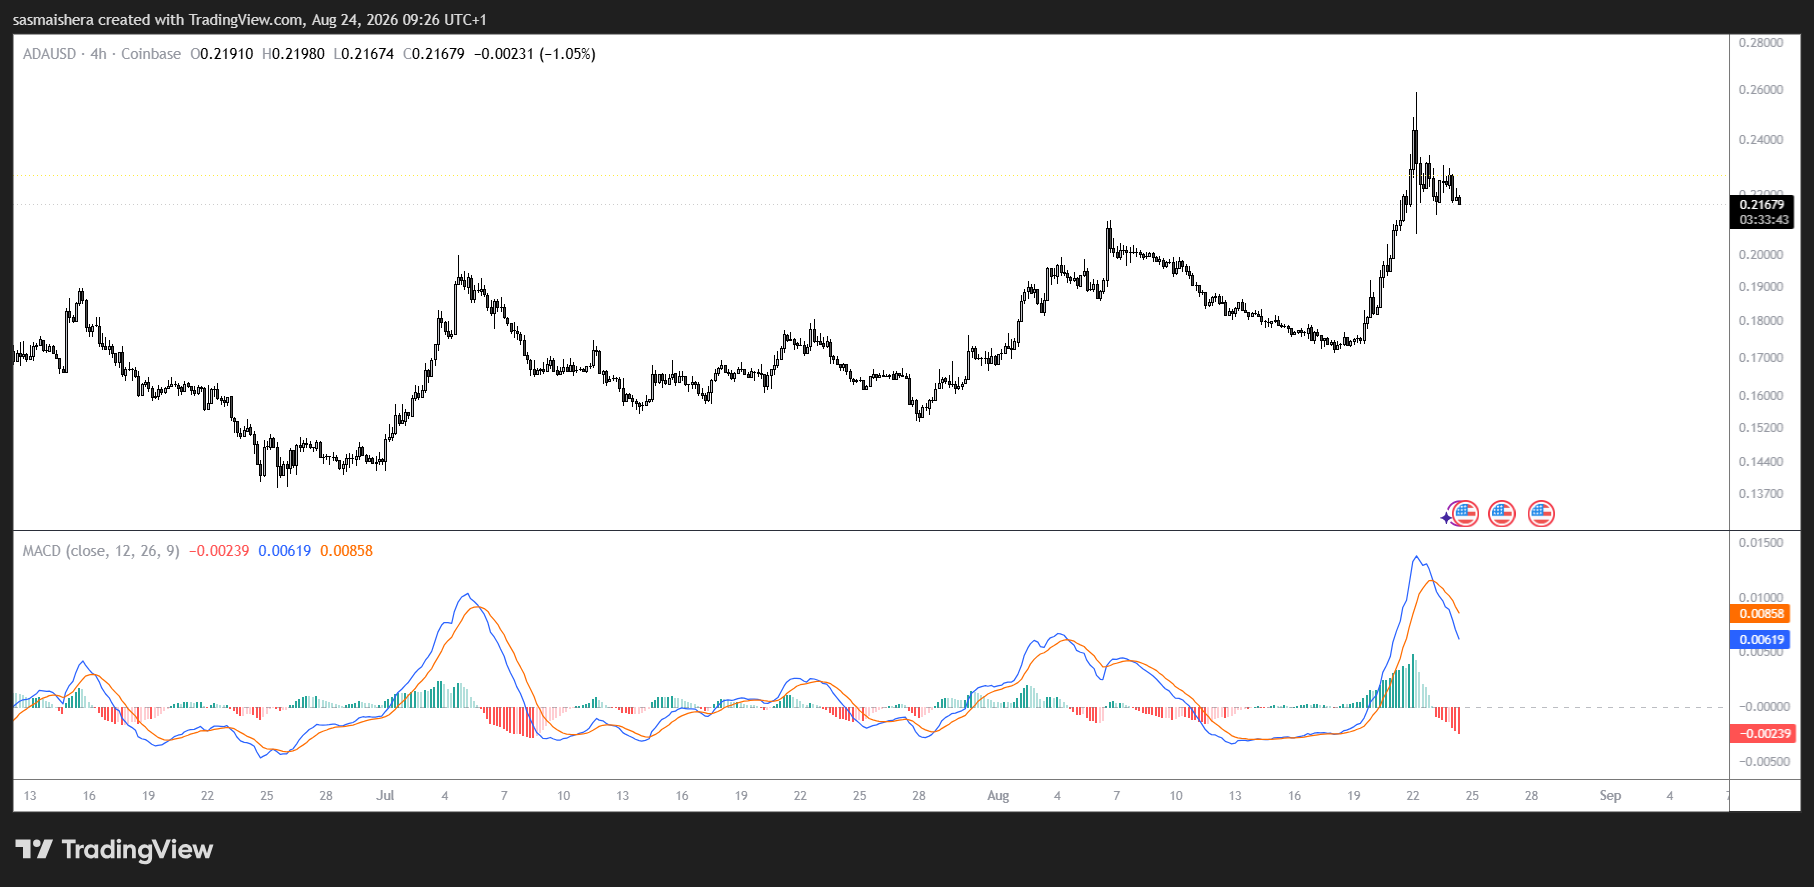
Further selling could push $ADA toward the 50-day EMA at $0.187, followed by structural support at $0.173.
Below those levels, traders may watch the former trendline resistance near $0.164 and the horizontal base at $0.150.
Cardano’s broader short-term outlook remains bullish while $ADA holds above $0.195.
However, whale selling, bearish derivatives positioning, and an elevated RSI increase the likelihood of consolidation before the next directional move.