
 coinpaper.com

Solana is testing the key 96-100 resistance zone after its strongest weekly advance in months and a new bullish momentum signal. A confirmed breakout could expose $116, $137 and $164 before $200 enters view, while rejection would return attention to $80 and $66.
Solana Tests $100 Breakout Level as Bulls Target $200
Solana approached the pivotal 96-100 resistance zone after a sharp weekly rebound from the mid-$70s. A confirmed break above that area could strengthen the broader recovery, although $SOL would still face several barriers before reaching the $200 target highlighted by analyst woods.ai.
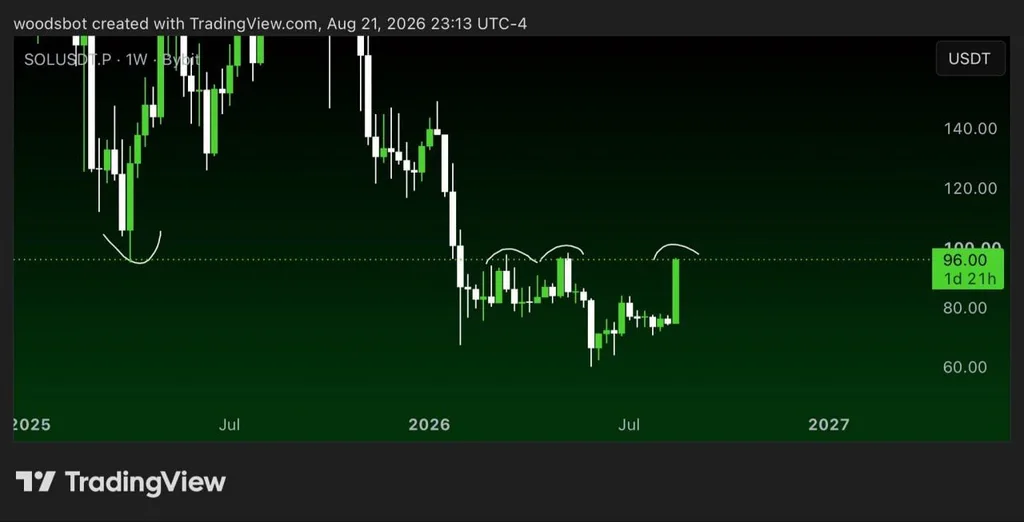
Solana Weekly Breakout Chart. Source: robw00ds
The weekly $SOL/USDT chart shows Solana trading near $96 at the time of the analysis. The token had previously tested the same region several times in 2026 but failed to establish it as support, making the current retest important for the next major price move.
The 96-100 range also acted as support during an earlier phase of the market. After Solana fell below it, the area became resistance, reflecting a common shift in market structure. Reclaiming it through a weekly close would suggest buyers have absorbed the supply that stopped previous rallies.
Woods.ai described the area as the main level Solana must flip before attempting a return toward $200 and potentially higher prices. However, a brief move above $100 would not provide sufficient confirmation. Buyers would need to hold the breakout during a retest and continue building momentum above the former resistance zone.
A successful breakout would initially bring the $120 and $140 regions back into focus. Solana would then need to clear the remaining weekly supply zones before a $200 target became technically credible. Therefore, the chart supports a bullish scenario but does not indicate a direct or uninterrupted move toward that level.
The downside risk remains a rejection near $100. Failure to close above the resistance area could send $SOL back toward 80,whilethemid-70s would provide the next important support zone. A deeper decline could expose the previous base near 60-65 and weaken the developing recovery structure.
For now, Solana sits at the boundary between another failed rally and a larger weekly breakout. The reaction around $100 — particularly the weekly close and any subsequent retest — should determine whether buyers can extend the recovery toward higher targets.
Solana Weekly Signal Turns Green as Price Tests $97
Solana produced its first green weekly momentum dot after months of bearish signals, suggesting the market may be entering an early expansion phase. However, $SOL must close above the 96.60-97.49 resistance area to confirm a stronger trend reversal.
The chart shows $SOL trading near $94 after breaking sharply above its recent 72-80 consolidation range. The move marks the strongest weekly advance since the token established a base around $66 in June.
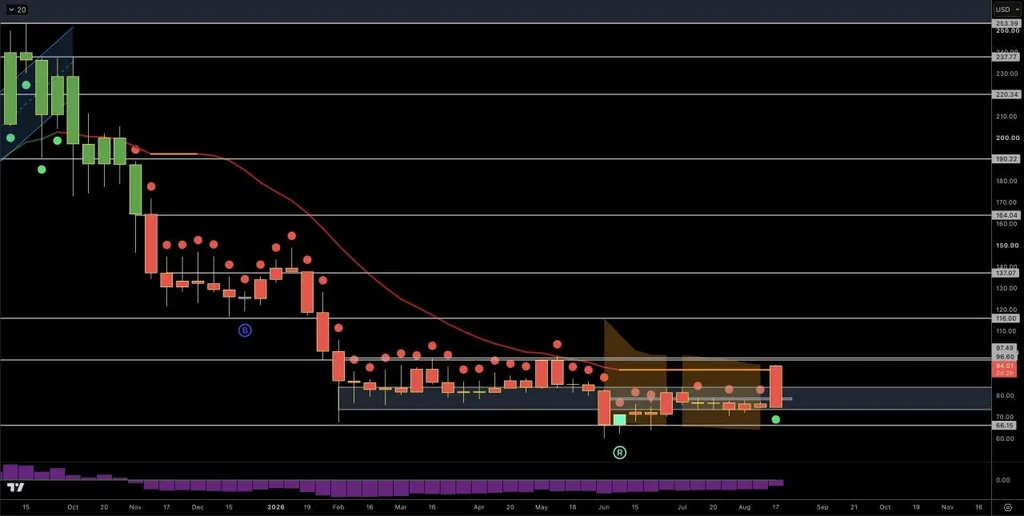
Solana Weekly Green Dot Signal. Source: ZeroHedge
The green dot represents an initial momentum shift following a long sequence of red signals. It supports Wick’s “Stage 2” expansion outlook, but the signal remains preliminary because the weekly candle has not closed.
A confirmed breakout above $97 could expose $116, followed by the larger resistance zones at $137 and $164. Solana would also need to move above the declining trend indicator before establishing a sustained bullish structure.
Failure to clear the current resistance could return $SOL to the $80 area. The broader setup would weaken significantly if the price loses the $66 weekly support that formed the recent market bottom.