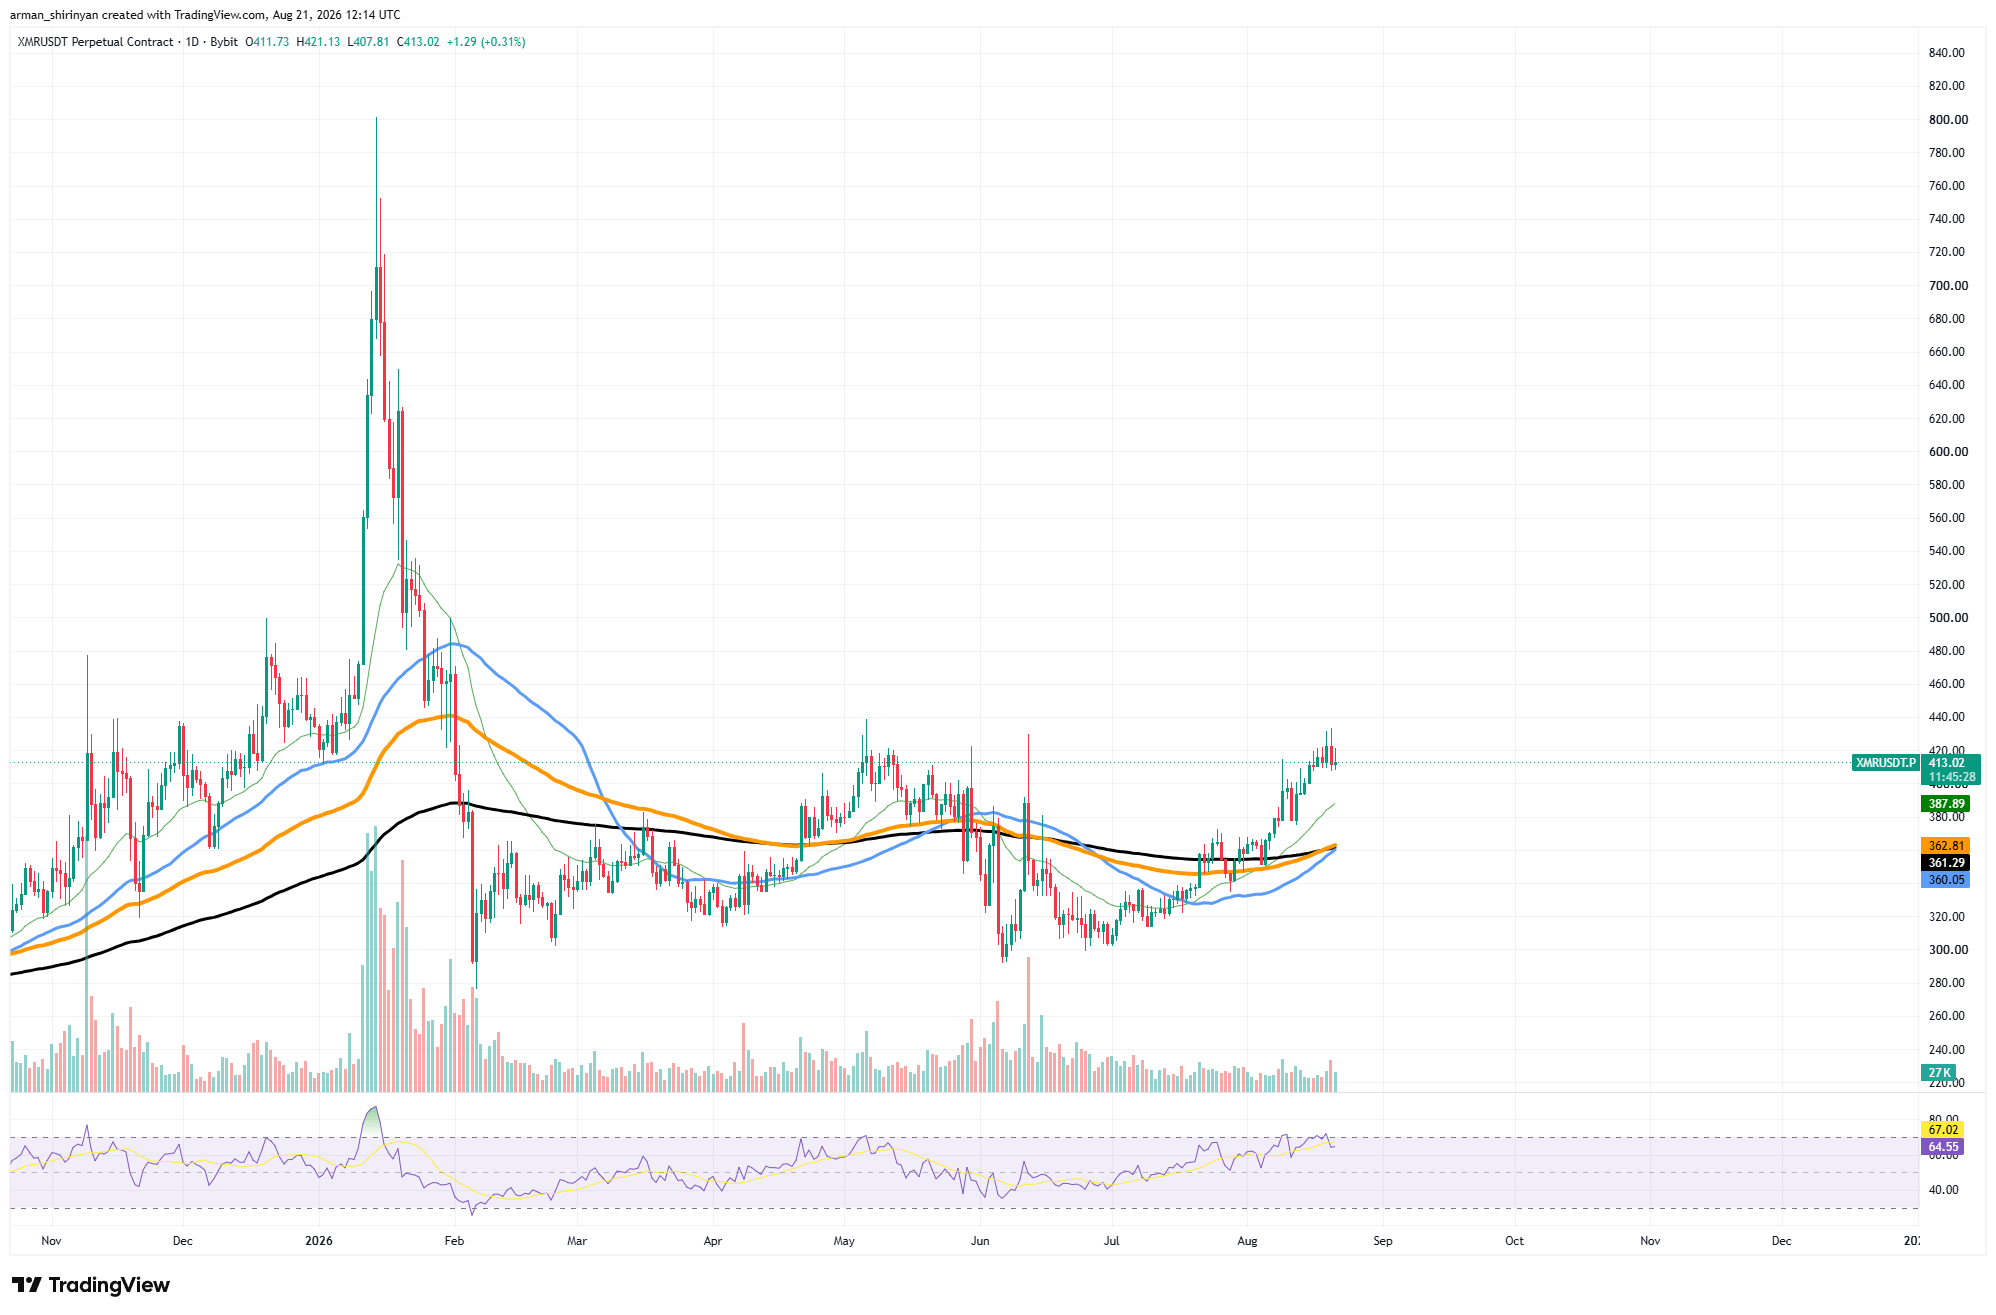
The blue moving average has risen to $360.09, while the orange moving average is currently close to $362.85. There is now less than $3 between them. $XMR will print a golden cross if the faster blue average keeps rising and crosses above the orange line. This indicates that medium-term momentum has shifted more and more in favor of buyers. The larger structure provides further confirmation.
Three significant averages have essentially compressed into the same $360–$363 range, as evidenced by the long-term black moving average, which is currently at $361.31. This cluster is becoming increasingly significant as $XMR trades more than 14% above it. However, momentum conditions must be taken into account before treating the signal as a guarantee of continuation.
RSI hits overbought thresholds
The RSI is already near the traditional overbought threshold of 70, at about 67. Additionally, $XMR has hit the resistance range of $415-$425, which rejected the price in May. Therefore, a breakout above roughly $425–$430 would carry greater immediate significance than the golden cross.
If that region is cleared, $440-$450 may come into view, followed by the much larger resistance zone at $480-$500. The first significant dynamic support is $388 if $XMR rejects from current levels instead.
The $360–$365 cluster becomes crucial below that. The bullish case is supported by the emerging golden cross, but the price has already largely anticipated the signal. To confirm the next phase of the recovery, $XMR must now turn its improving moving-average structure into a breakout above the May highs.

 u.today