
 thecryptobasic.com

$XRP price has surged 16% over the past day, climbing to around $1.15 after briefly falling to $0.98 last week.
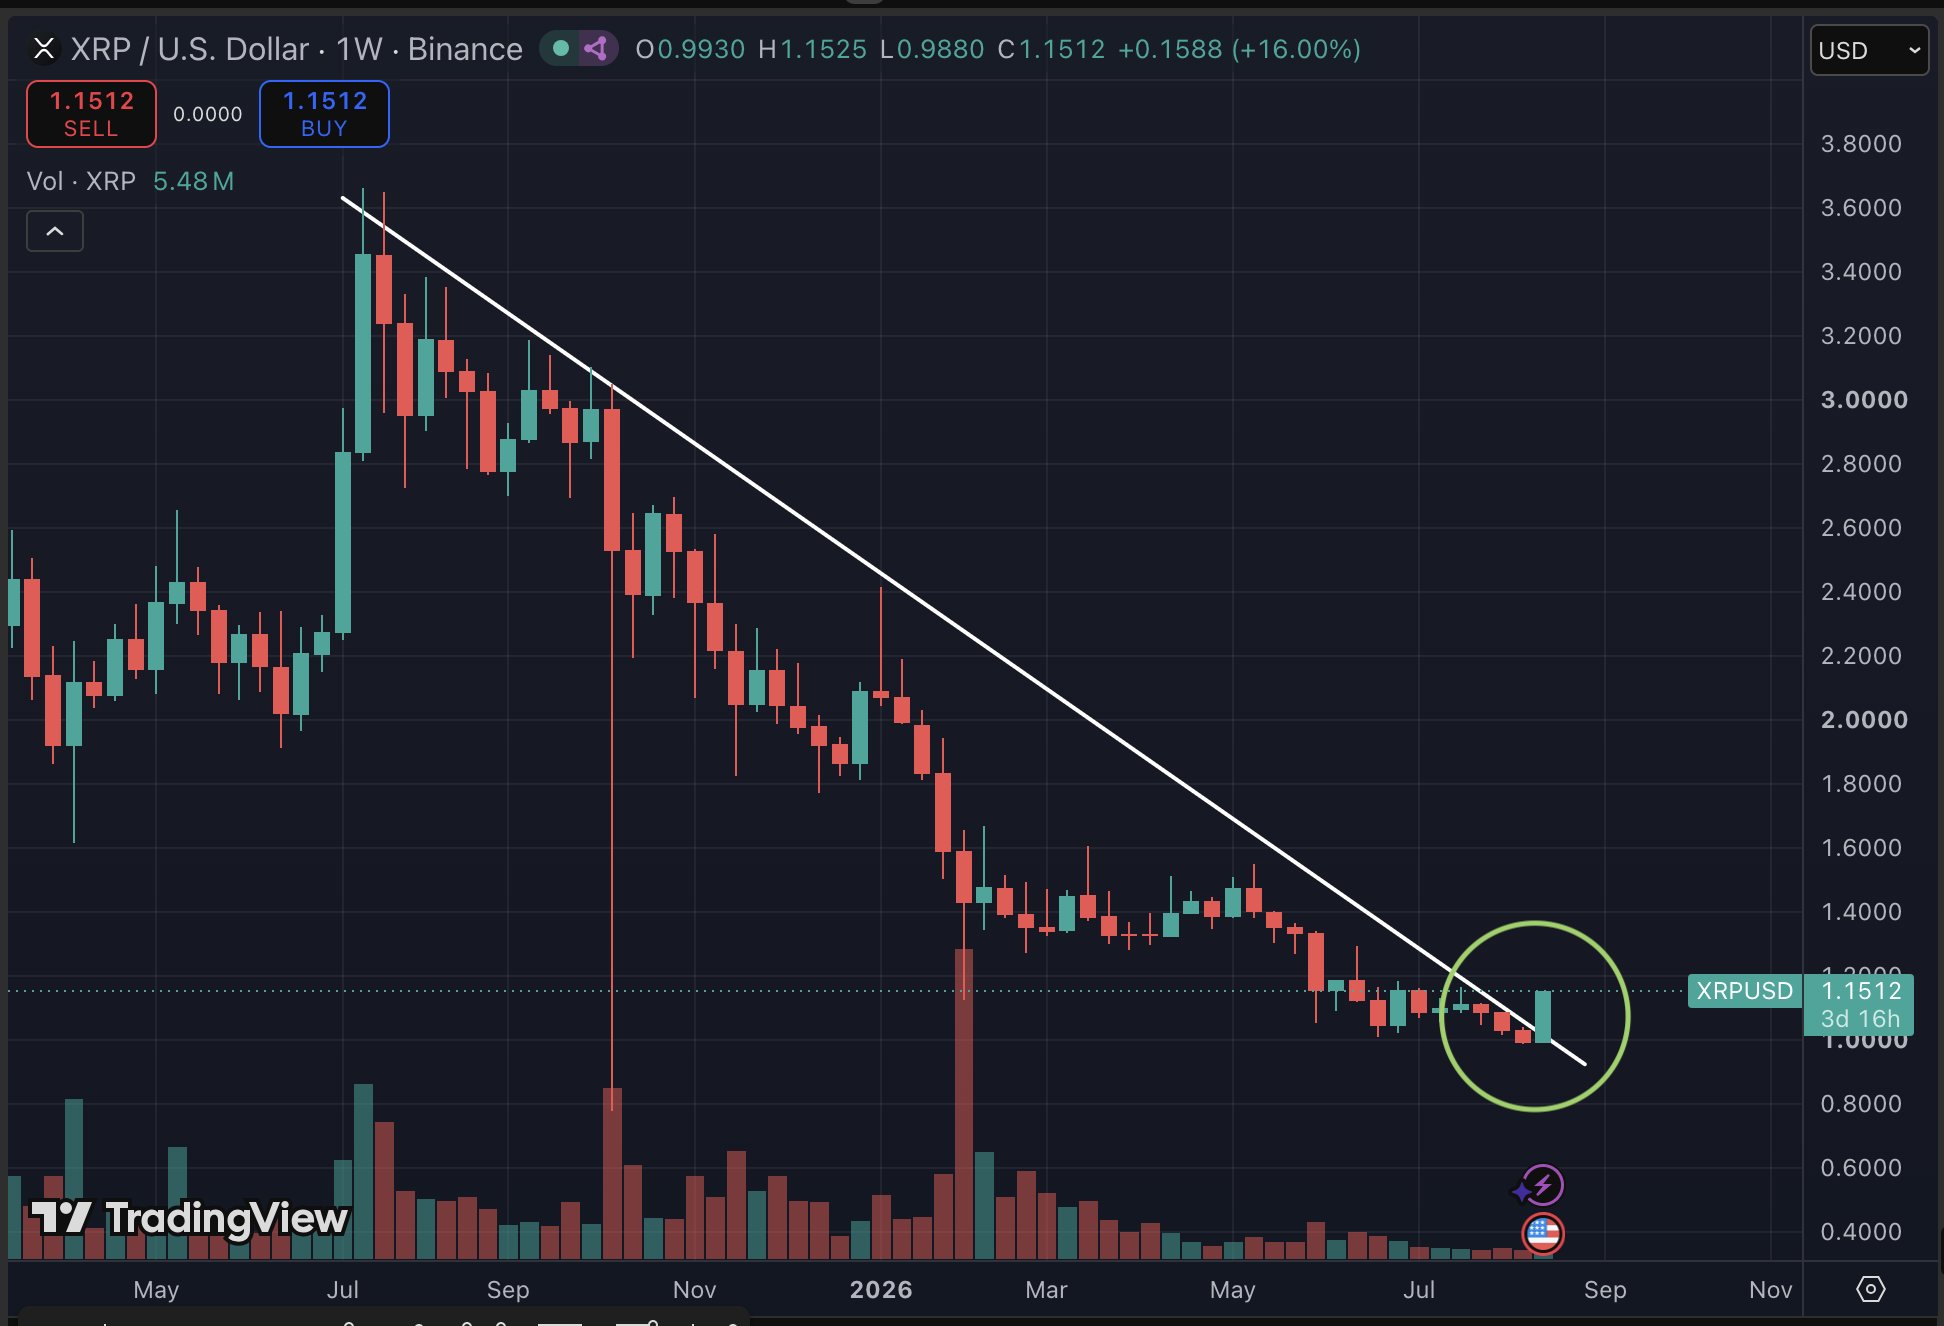
Interestingly, the rebound has pushed the coin above a primary descending trendline that had capped its price since July 2025. The latest breakout may mark a major upset in the token’s long-running downtrend.
$XRP Breaks Year-Long Bear Market Trendline
On X, market watcher Bird said $XRP has “officially broken out” of the bear market trendline in place since July 2025. He cited more than a year of downward price action, arguing that the latest surge represents a decisive break from the trend.
The accompanying weekly chart shows $XRP moving above a descending resistance line that began near the token’s 2025 peak and continued to guide its price lower through 2026. The breakout comes after $XRP fell to approximately $0.98 last week before reversing sharply higher.
$XRP Reclaims the 50 EMA
Technical analyst ChartNerd also highlighted an important development on $XRP’s daily chart. According to the analyst, $XRP’s daily candle closed at $1.10, marking its first close above the daily 50 EMA in more than three months.
The move matters because the 50 EMA acted as a key technical barrier during $XRP’s prolonged decline. Reclaiming the indicator signals that short-term momentum is shifting in favor of buyers.
ChartNerd has now posed a key question for $XRP traders: What comes first — $1.50 $XRP or $1.00 $XRP?
That question reflects the sharp change in market momentum following $XRP’s recovery from below $1.
More Bullish Calls
Analyst Michael XBT also expressed a strong bullish outlook for $XRP amid the ongoing breakout. Since last week, when $XRP price dipped under $1, he has urged $XRP holders not to sell.
The last price action has now reinforced his outlook. Michael’s long-term chart highlights a large multi-year pattern, which he describes as a seven-year pennant approaching a breakout.
“History will repeat,” Michael XBT wrote, adding that he believes the current setup could fulfill his earlier bullish prediction.
Price Still Faces a Major Test
Despite the breakout, $XRP’s broader performance remains considerably weaker than its latest 24-hour move suggests. The cryptocurrency’s sharp rebound has not yet erased its longer-term losses, with $XRP still down approximately 15.35% over the past 90 days.
That makes the $1.10-$1.15 region an important area for bulls. Holding above the broken trendline and maintaining the 50 EMA reclaim could strengthen the case that $XRP’s prolonged downtrend is ending.
Conversely, a failure to sustain the breakout could turn the move into another false breakout and reopen the possibility of a return toward the $1 level.
Meanwhile, the ongoing move is being supported by Bitcoin, which is now above $72,500. Provided BTC remains up, the environment could support higher prices for $XRP.