
 ambcrypto.com

TRON [$TRX] is building up around the $0.333 price by strong ecosystem inflows and treasury buildup in the broader demand story.
TRON’s treasury has jumped to more than 710.6 million $TRX after the company acquired 149,643 tokens at $0.3341.
Separately, over $100 million entered $TRX and stablecoins on TRON through deBridge during the past 30 days. This activity involved 2,241 trades, with an average value of $44,600 and a maximum transaction of $2,000,000.
The $TRX purchases also accounted for 32% of the total volume recorded, showing significant capital involvement in the ecosystem. These developments emerged while $TRX consolidated beneath its resistance, making its technical structure important for the next price recovery.
$TRX holds $0.3224 support as resistance limits recovery
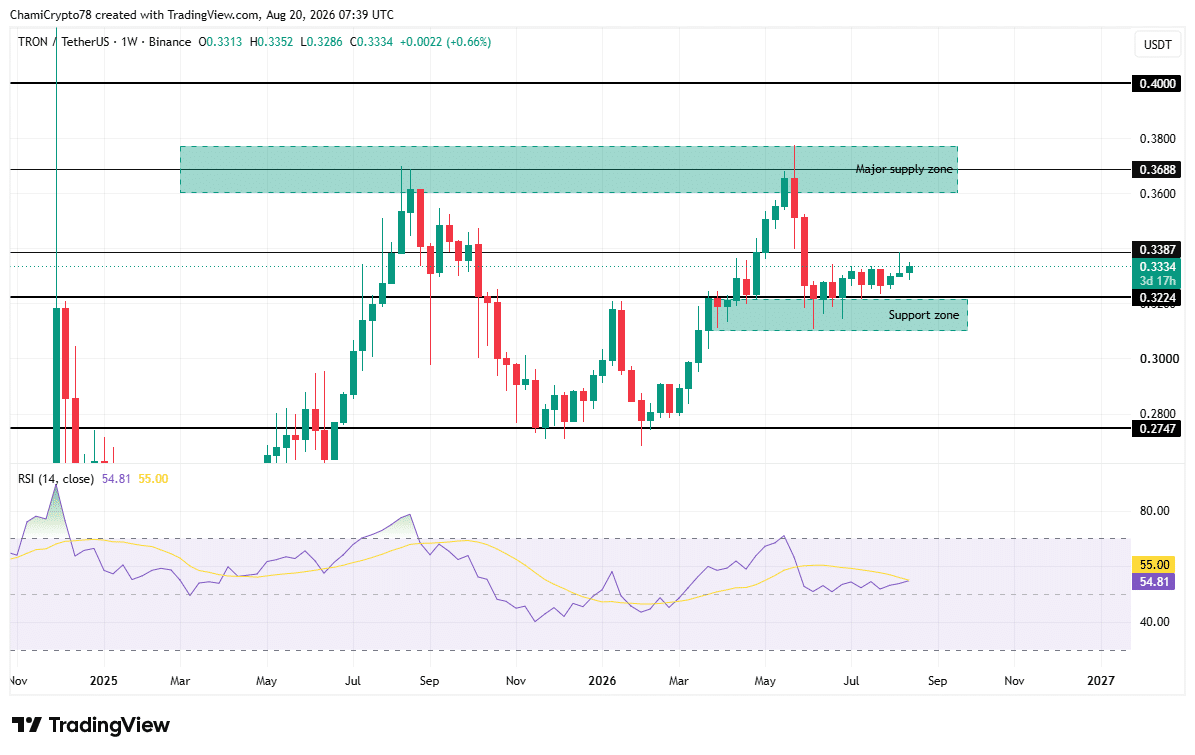
$TRX has maintained $0.3224 after rebounding from the broader support zone extending toward $0.3100. Buyers have repeatedly defended this region, preventing the May correction from developing into a deeper structural decline.
Since then, the token’s price has bounced back to $0.3334, making the resistance level at $0.3387 attainable.
Breaking $0.3387 would expose the major supply zone around the $0.3600 and $0.3688 area. This region previously rejected Tron’s recovery sharply, making another test important for the broader bullish structure.
Meanwhile, RSI stood at 54.81 in the neutral territory, marginally below its 55.00 moving average. The neutral area allows room for buyers to further increase purchases before hitting the overbought levels.
Therefore, $0.3224 protects the recovery structure, while $0.3688 remains the major obstacle to further expansion.
Fibonacci zones define $TRX’s recovery toward $0.40
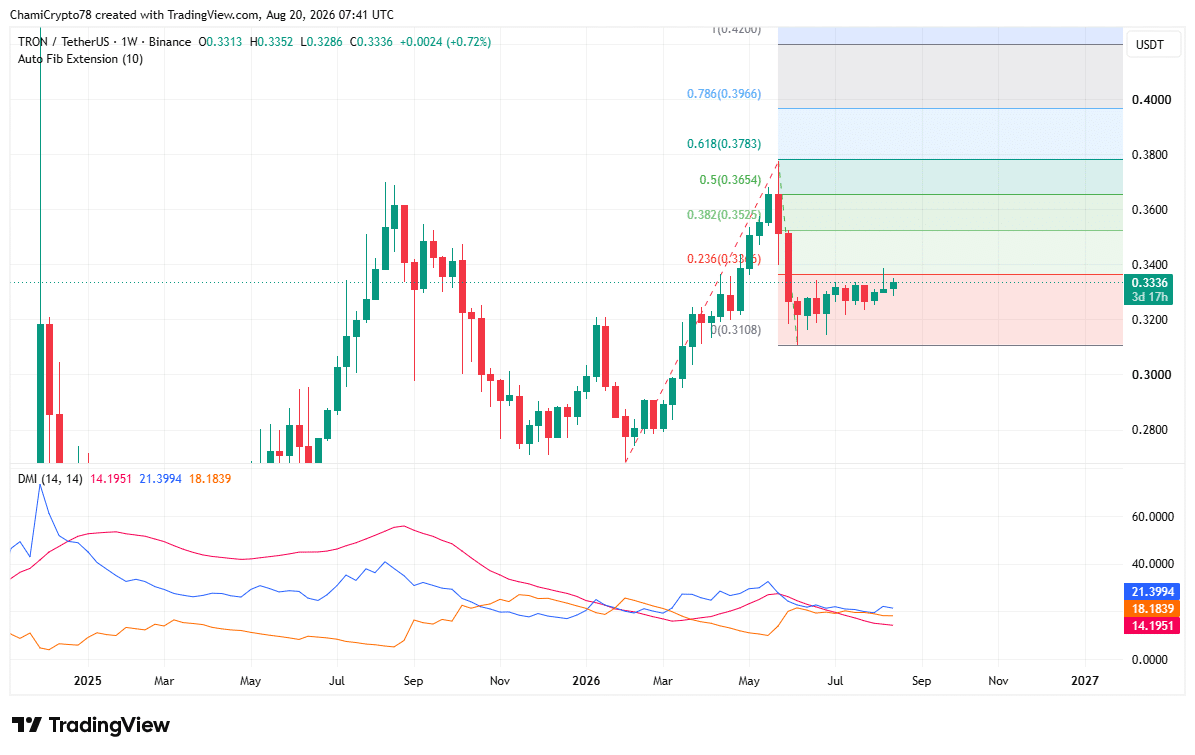
$TRX’s Fibonacci structure identifies several potential reaction zones as price recovers from the $0.3108 swing low.
At press time, price trades around $0.3336, immediately below the 23.6% level at $0.3355. The shallow retracement zone is the first challenge to gauge if buyers can maintain the recovery.
Above it, the 38.2% level at $0.3525 represents another potential resistance area. Clearing this zone would mean that buyers are absorbing the progressively strong selling pressure.
The 50% mid-point at $0.3654 is also of importance as it coincides with the wider weekly supply area. This could, therefore, be a period of heightened selling pressure on price.
A successful move through $0.3654 would bring the 61.8% golden-ratio level at $0.3783 into focus. This zone is a major technical barrier in front of the deeper 78.6% zone at $0.3966.
Therefore, $0.3966 places Tron close to $0.40, but several reaction zones must first be reclaimed.
The directional indicators are slightly bullish, with +DI at 21.3994 compared to -DI at 18.1839. ADX at 14.1951, however, indicates low trend strength.
Liquidation liquidity surrounds $TRX above and below
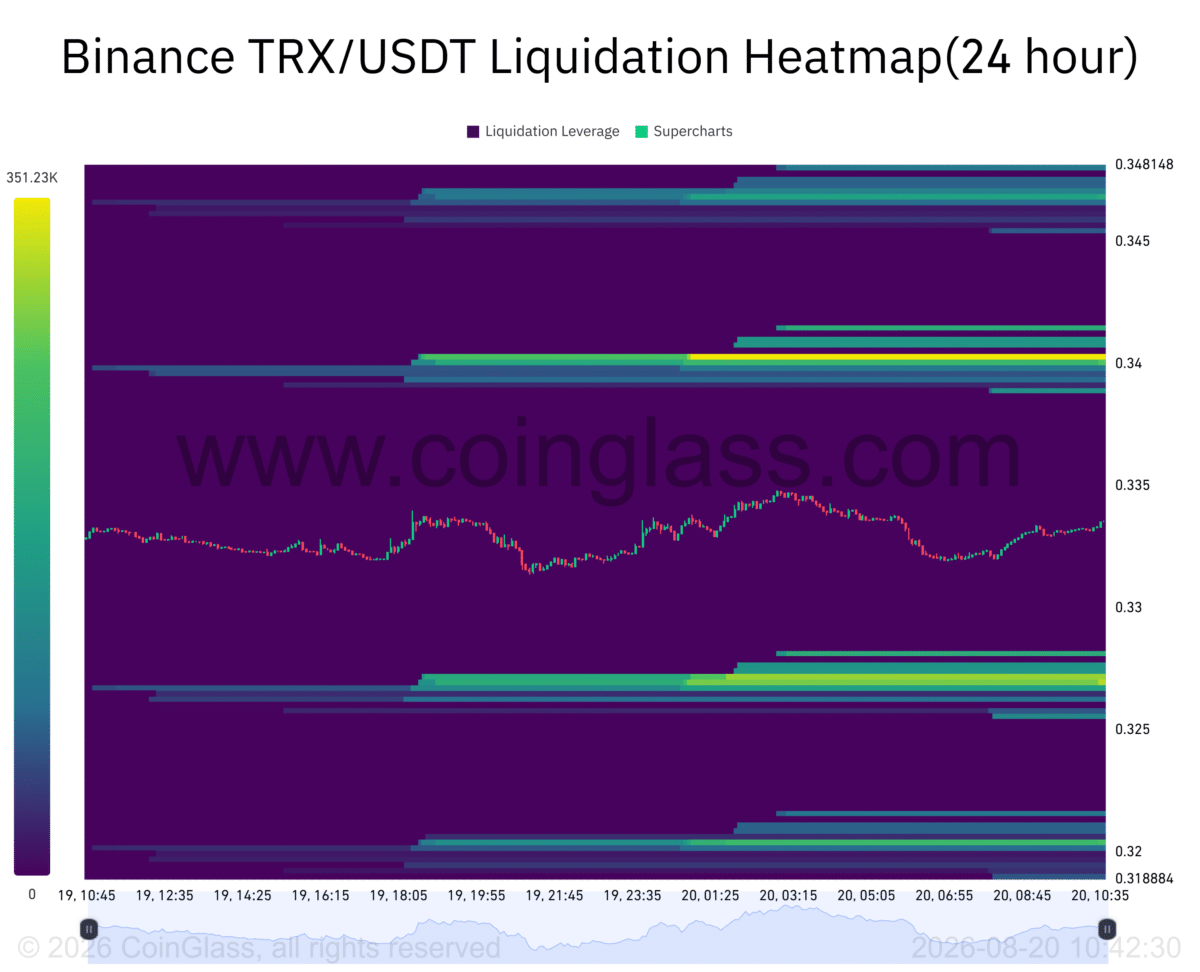
According to Binance Liquidation Heatmap, there is significant liquidity on both sides of $TRX’s price.
The strongest nearby upside concentration sat around the $0.340 level. This level could attract the price after a successful break above $0.3387.
The move would help support the path to the $0.3525 Fibonacci resistance level and ultimately the higher-level supply area.
Besides, downside liquidity remains concentrated around $0.326–$0.327, though not as dense as the upside liquidity.
Can $TRX reach $0.40?
$TRX retains a moderately bullish structure while $0.3224 remains protected and buyers maintain their directional advantage.
Breaking $0.3387 could expose successive Fibonacci resistance zones through $0.3966. Clearing the $0.3600–$0.3688 supply region would particularly strengthen the case for $0.40.
Final Summary
- TRON treasury accumulation and $100 million inflows strengthen $TRX’s underlying demand narrative.
- $TRX holding $0.3224 keeps $0.3688 and eventually $0.40 within reach.