$16B stablecoin outflow vs 10,883 BTC demand: What’s really happening?
ambcrypto.com
19 August 2026 22:00, UTC
The stablecoin market has been a major disappointment this cycle.
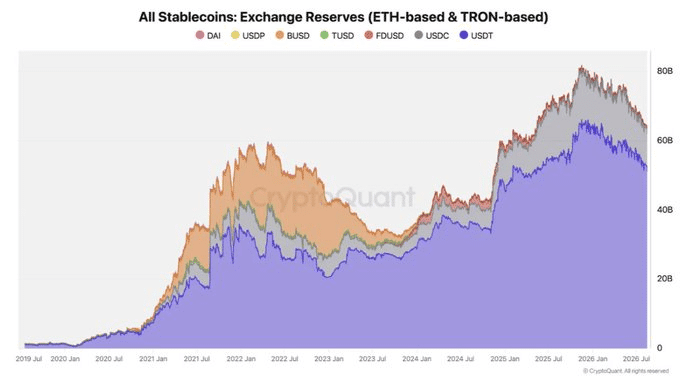
From a technical standpoint, more than $10 billion have left the crypto ecosystem so far this year, marking the largest liquidity contraction on record in terms of absolute value. And this development is clearly not unrelated to the 25% drop in the total crypto market cap over the same period.
With that said, the chart above may be even more noteworthy. According to CryptoQuant’s data, stablecoin liquidity on exchanges peaked at $80 billion to $64 billion before starting its downward trajectory. The largest loser in the process was Binance, which saw its market share increase from 60 to 68.5%, while the rest witnessed a significantly steeper contraction.
Know when your coins move
Alerts, real-time prices, and market news — all in one app
Point your phone camera to install
4.8 based on 40K reviews in the App Store and Google Play
Source: CryptoQuant
In other words, Binance is capturing a substantial amount of the “shrinking” stablecoin liquidity. Increased Binance dominance from 60% to 68.5% indicates that the lion’s share of liquidity is concentrated on the exchange. Meanwhile, other platforms experience an extreme drain of stablecoin liquidity.
Notably, analysts note that the inflow into Binance and the corresponding outflow from other exchanges represent a bearish sign. The rationale behind this assumption is that overall market liquidity is becoming increasingly concentrated on the world’s largest crypto exchange. As a result, the buying power of other platforms is severely hindered.
By this logic, one could assume that Bitcoin and other large-cap assets would break lower from their consolidation patterns, unlocking a broader sell-off of crypto assets. However, several on-chain signals provide grounds for belief that stablecoin outflows may not be entirely bearish.
While decreasing liquidity may indicate bearish intentions, on-chain data shows an alternate narrative.
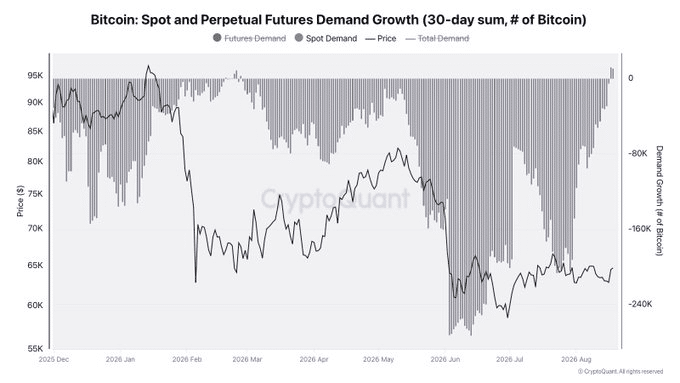
In particular, observe the return of demand in spot markets versus a contraction in speculative demand. Year-to-date in 2026, a wave of speculative demand sidelined retail investors as spot demand failed in the wake of heightened volatility, generating a risk-off environment that appears to have since reversed.
Notably, Bitcoin’s combined futures and spot demand, measured in terms of 30-day sum total, has reached a 2026 peak of 10,883 BTC, suggesting a return of buying pressure in spot markets and a reduction in speculative positioning. This reflects positively on the token’s overall demand profile, with real spot buying offsetting some of the pressure from speculative liquidity.
Source: CryptoQuant
Against this backdrop, a decrease in stablecoin liquidity may very well be less bearish than it seems.
Typically, rising stablecoin outflows while spot demand picks up could signal that capital is moving back into risk assets. This could bring retail back into the market, especially as macro FUD continues to pressure other risk assets. If this trend holds, it could be the first real sign that the market is starting to form a bottom.
Final Summary
Stablecoin liquidity is falling, but spot demand is coming back.
If this continues, it could signal a market bottom.

 ambcrypto.com