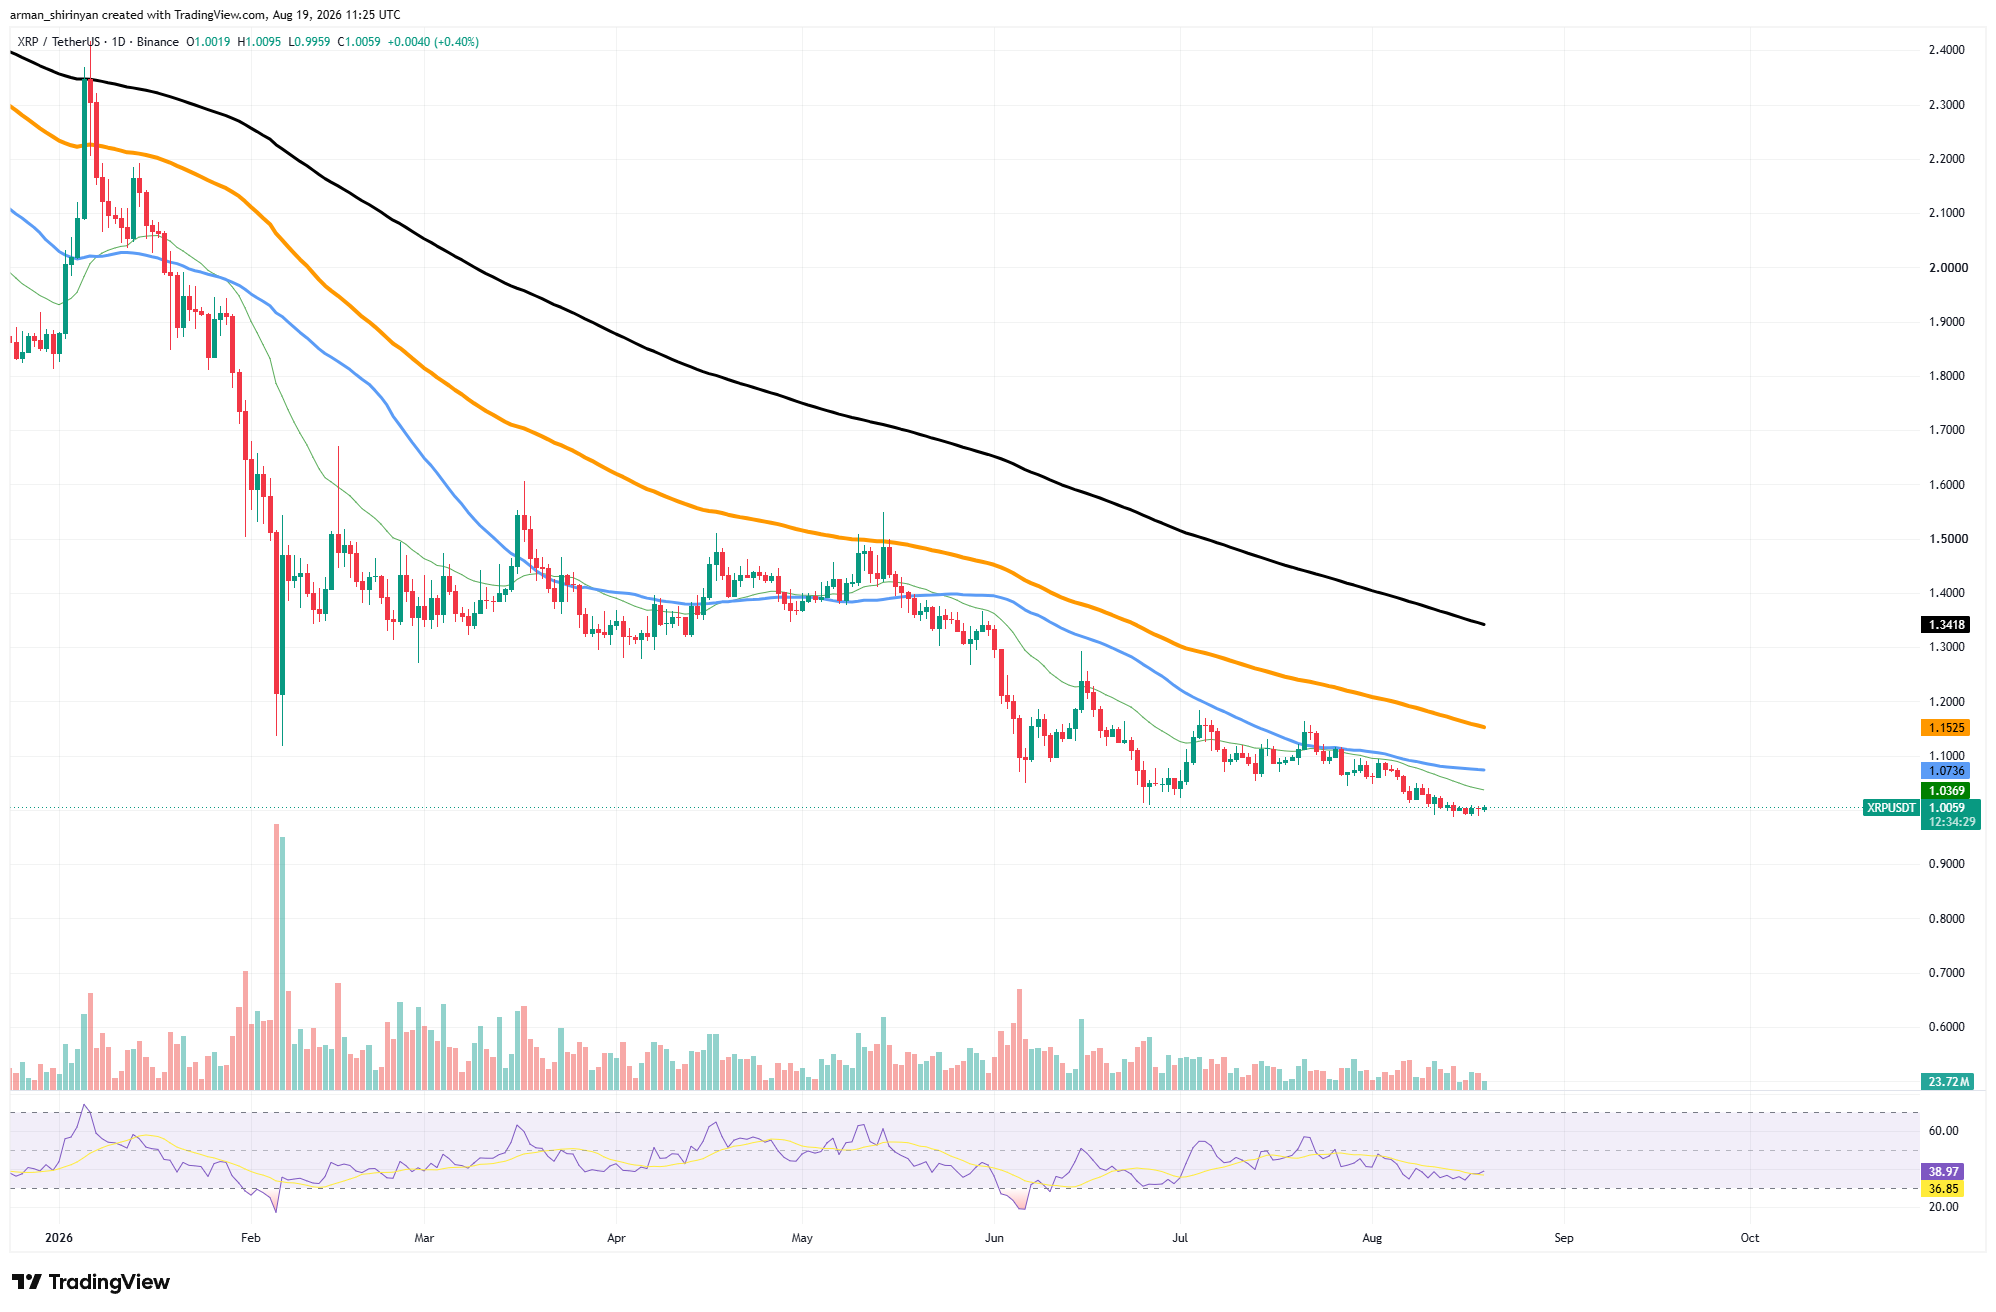
As a result, there may be a bullish RSI divergence as the price declines and the downward momentum gradually weakens. When sellers maintain control but weaken, such divergences frequently occur.
They do not promise an instant reversal. Before the divergence results in any discernible price reaction, $XRP may continue to decline or consolidate close to current levels. That distinction is particularly crucial because of the moving-average structure. Every significant average displayed on the chart is still above $XRP. The blue average is close to $1.07, and immediate resistance is at $1.04.
Key threshold surpassed
The long-term average is much higher at about $1.34, but there is still more significant resistance around $1.15. Another intriguing component is provided by network activity. In early August, the number of $XRP Ledger transactions surged to three million per day, and in August, it surpassed two million once more.
Although activity has since decreased, the network has handled more than one million transactions every day for the majority of the last month. The price of $XRP must react for the RSI divergence to receive technical confirmation. While regaining $1.07 would strengthen the case that momentum divergence is translating into actual demand, a recovery above $1.04 would be an initial improvement.
It is still possible for the opposite to occur. The immediate stabilization attempt would be invalidated and $XRP would be vulnerable to further price discovery below its recent lows if there were a clear breakdown below $1. For the time being, the divergence serves as a warning not to assume that $XRP's decline will continue at the same rate. Although momentum suggests that sellers' advantage is starting to wane, sellers are still in control.

 u.today