
 invezz.com

Stellar ($XLM) remains under pressure on Tuesday as uncertainty across the broader cryptocurrency market and weak technical momentum weigh on Stellar.
$XLM is down by more than 2% in the last 24 hours, extending its corrective decline beneath $0.155.
Mixed derivatives and on-chain indicators point to cautious sentiment, leaving $XLM at risk of additional losses.
$XLM maintains bearish bias despite Bitcoin’s rally
$XLM is underperforming despite Bitcoin hitting the $64,000 level on Monday. The bearish performance comes as derivatives data indicates that traders are reducing their positions in the market.
CoinGlass data shows that the long-to-short ratio for $XLM stands at 0.90. A reading below one means short positions outnumber long positions, indicating that more traders are betting on prices falling than rising.
The funding rate also supports the current bearish price action. $XLM’s funding rate turned negative on Tuesday and now reads -0.0215%.
A negative funding rate indicates that traders holding short positions are paying those with long positions, suggesting that the bears are in control of the market.
Similar to XRP, $XLM’s CryptoQuant indicators suggest a bearish outlook. The indicator shows sell-side dominance across its markets alongside large whale orders.
These conflicting signals suggest that major participants remain active, but selling pressure continues to control the near-term trend.
The derivative data has supported the bearish price action in recent weeks.
While Bitcoin has been consolidating between $62,000 and $64,000 in recent weeks, $XLM has lost 17% of its value in the last one month and could record further losses in the near term.
$XLM price outlook: Stellar approaches oversold conditions
The $XLM/USD 4-hour chart is bearish and efficient as Stellar trades at approximately $0.154 on Tuesday, extending its decline below all major daily EMAs.
The 50-day EMA at $0.173, the 100-day EMA at $0.178 and the 200-day EMA at $0.190 form a significant resistance cluster.
As long as $XLM remains below these levels, the broader technical outlook will remain bearish.
The RSI is near 36, placing $XLM close to oversold territory. Meanwhile, the MACD has turned marginally positive around its zero line, suggesting that selling momentum may be weakening.
However, neither indicator confirms a sustainable recovery while the price remains below the major moving averages.
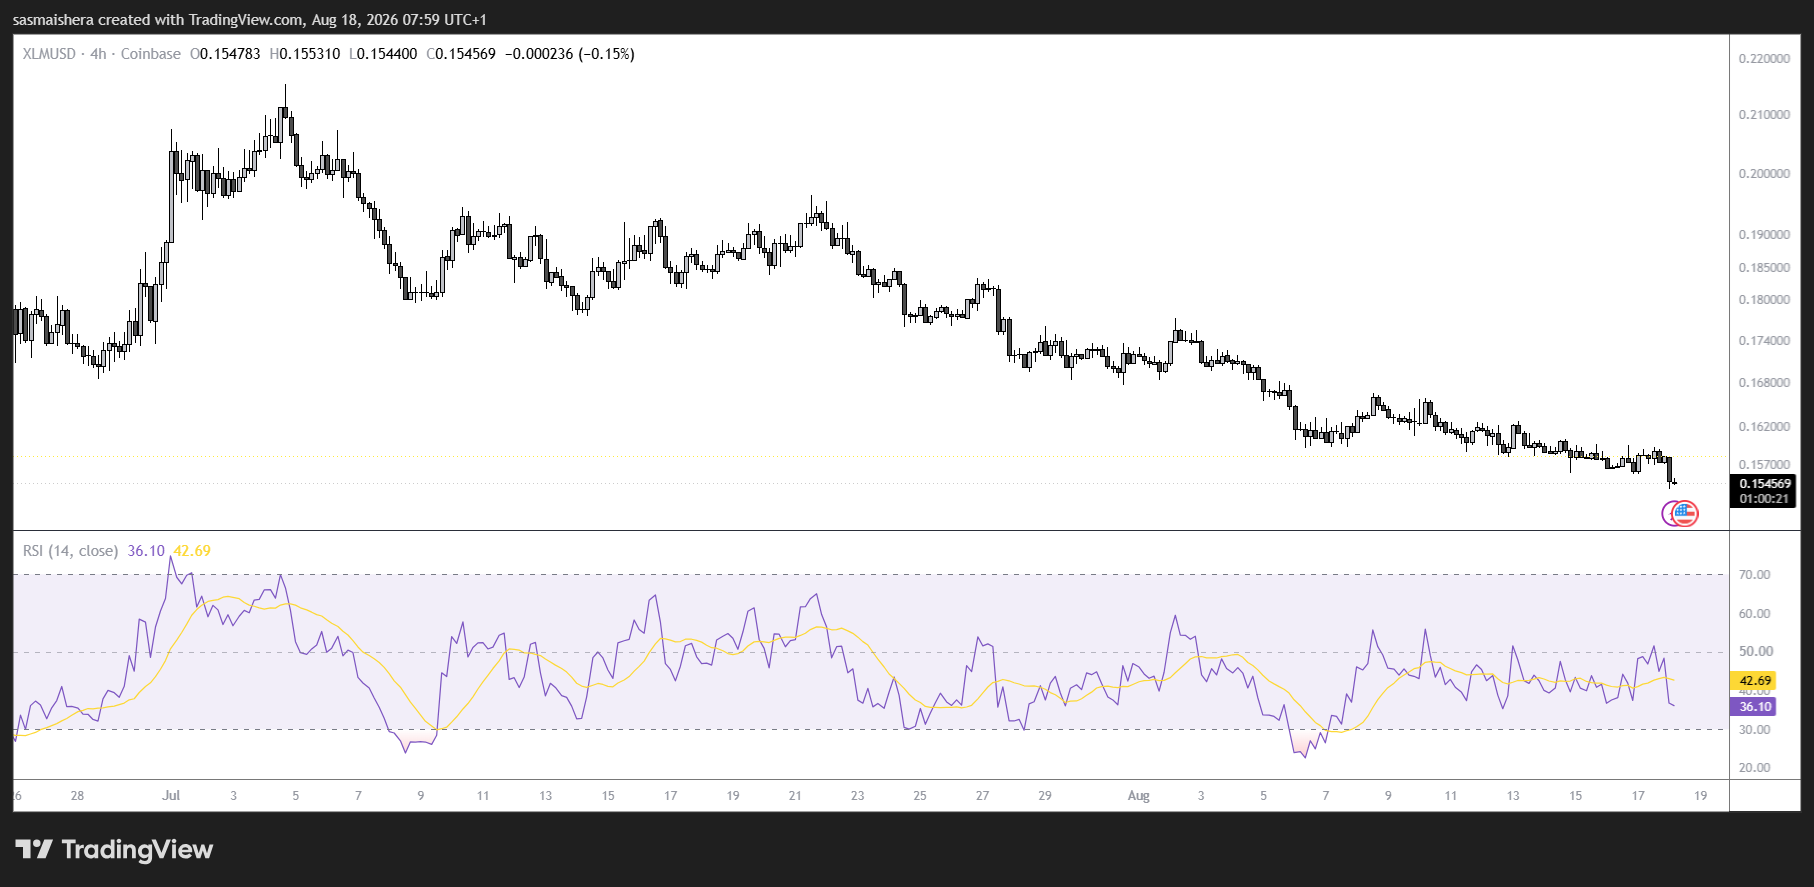
The first meaningful resistance sits around $0.173, where the 50-day EMA aligns with the 78.6% Fibonacci retracement. The next barriers are located at $0.177 and the 100-day EMA at $0.178.
A stronger recovery could target the 200-day EMA at $0.190, followed by Fibonacci resistance at $0.200, $0.218, $0.237 and $0.260. The cycle high near $0.298 remains a distant target.
On the downside, $XLM could test the support zone between $0.142 and $0.139. A decisive daily close below this range would strengthen the bearish outlook and could trigger a deeper decline.