
 coinpaper.com

Solana is holding near $75 as traders watch whether $SOL can break short-term resistance or first revisit support around $67 before its next major move. Two technical setups point to bullish recovery scenarios, with near-term targets around $87 and a broader daily-chart objective near $130 if buyers reclaim several key resistance levels.
Solana Tests Descending Resistance as Trader Maps $130 Upside Scenario
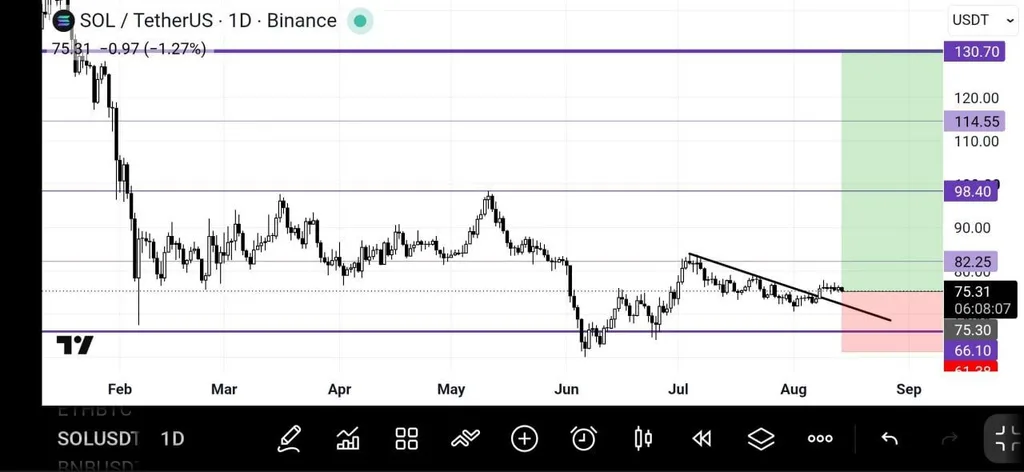
Solana is pressing against a descending trendline after spending much of July and early August below a sequence of lower highs. Trader Daink’s daily $SOL/USDT chart presents a bullish swing setup from around $75, but the path toward the projected $130 target requires $SOL to clear several major resistance levels first.
Solana $SOL Daily Chart Descending Trendline․ Source: Daink (@TraderDaink) on X
$SOL trades near $75.31 on the chart, close to the point where a descending resistance line from the early-July high meets the current price. That makes the immediate area important: a sustained move above the trendline would weaken the short-term bearish structure and could give buyers room to challenge higher resistance.
The first major level above price is $82.25. Solana previously reacted around this zone, and reclaiming it would provide stronger confirmation that the breakout is developing rather than becoming another rejection from descending resistance. Above $82.25, the chart marks $98.40 as the next significant hurdle.
A break through $98.40 would materially strengthen the bullish scenario because it would move $SOL above a resistance area that capped price during earlier rebounds. From there, the chart identifies $114.55 before the larger upside objective around $130.70. The green projection on the chart shows that $130 area as the trader’s main swing target, not as a guaranteed destination.
The downside remains equally important. $SOL is still trading only modestly above the chart’s major support around $66.10. A rejection from the descending trendline followed by a drop toward that level would signal that sellers remain in control. Losing $66.10 would undermine the bullish setup and raise the risk of a deeper move toward the lower boundary shown near $61.28.
For now, the chart favors watching confirmation rather than assuming an immediate rally to $130. A daily breakout through the descending trendline, followed by a successful move above $82.25, would strengthen the bullish case. Failure to clear resistance and a break below $66.10 would instead invalidate much of the setup and keep Solana vulnerable to renewed downside.
$SOL Could Retest $67 Support Before a Larger Recovery
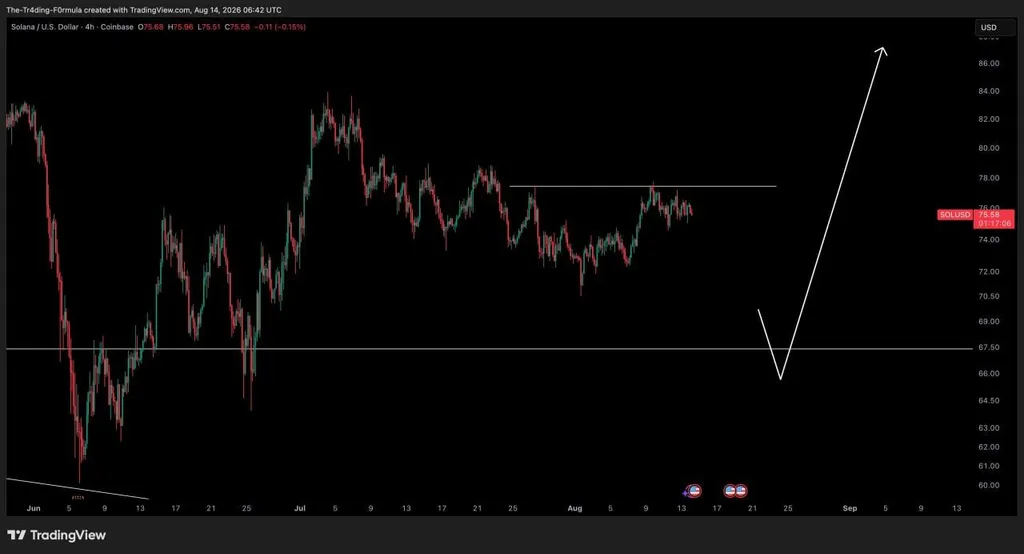
A second Solana chart points to a different route higher, with Crypto Tony watching for a possible deeper pullback before buyers regain control. The four-hour $SOL/USD chart shows price near $75.58, below resistance around the upper-$77 area, while a major horizontal support zone sits near $67.50.
Solana $SOL Four-Hour Chart With $67.50 Support․ Source: Crypto Tony (@CryptoTony__) on X
$SOL has struggled to sustain moves above roughly $77 to $78, making that area the immediate resistance to watch. Price has tested the region several times since late July without producing a decisive breakout, leaving Solana in a short-term range as buyers and sellers compete for control.
Crypto Tony’s projected path allows for a considerably deeper retracement before the next bullish move. The chart shows $SOL potentially falling through the $67.50 horizontal support area and briefly reaching roughly $65 to $66 before reversing sharply higher. However, the trader also makes clear that the pullback may not extend that far, so the projected drop should be treated as a scenario rather than a forecast that must occur.
If $SOL does retreat toward $67.50, the reaction around that level would become more important than simply reaching it. A quick recovery after testing the support zone, especially if price reclaims $67.50 following a temporary breakdown, would suggest that buyers are absorbing selling pressure and could provide confirmation for the bullish reversal shown on the chart.
The first obstacle on any recovery remains the $77 to $78 resistance area. Breaking and holding above that ceiling would strengthen the case for a larger advance and shift attention toward the low-$80s. The chart’s projected move ultimately extends toward roughly $87, suggesting that a successful support test could lead to a much stronger rebound.
The bullish scenario would weaken if $SOL falls below the projected $65-$66 reversal area and fails to recover. In that case, the anticipated liquidity sweep and rebound would instead look more like a genuine support breakdown.
Combined with the daily chart, the setup presents two possible paths for Solana. $SOL could break higher directly from its current consolidation, or it could first revisit deeper support before beginning a stronger recovery.