
 cryptoticker.io

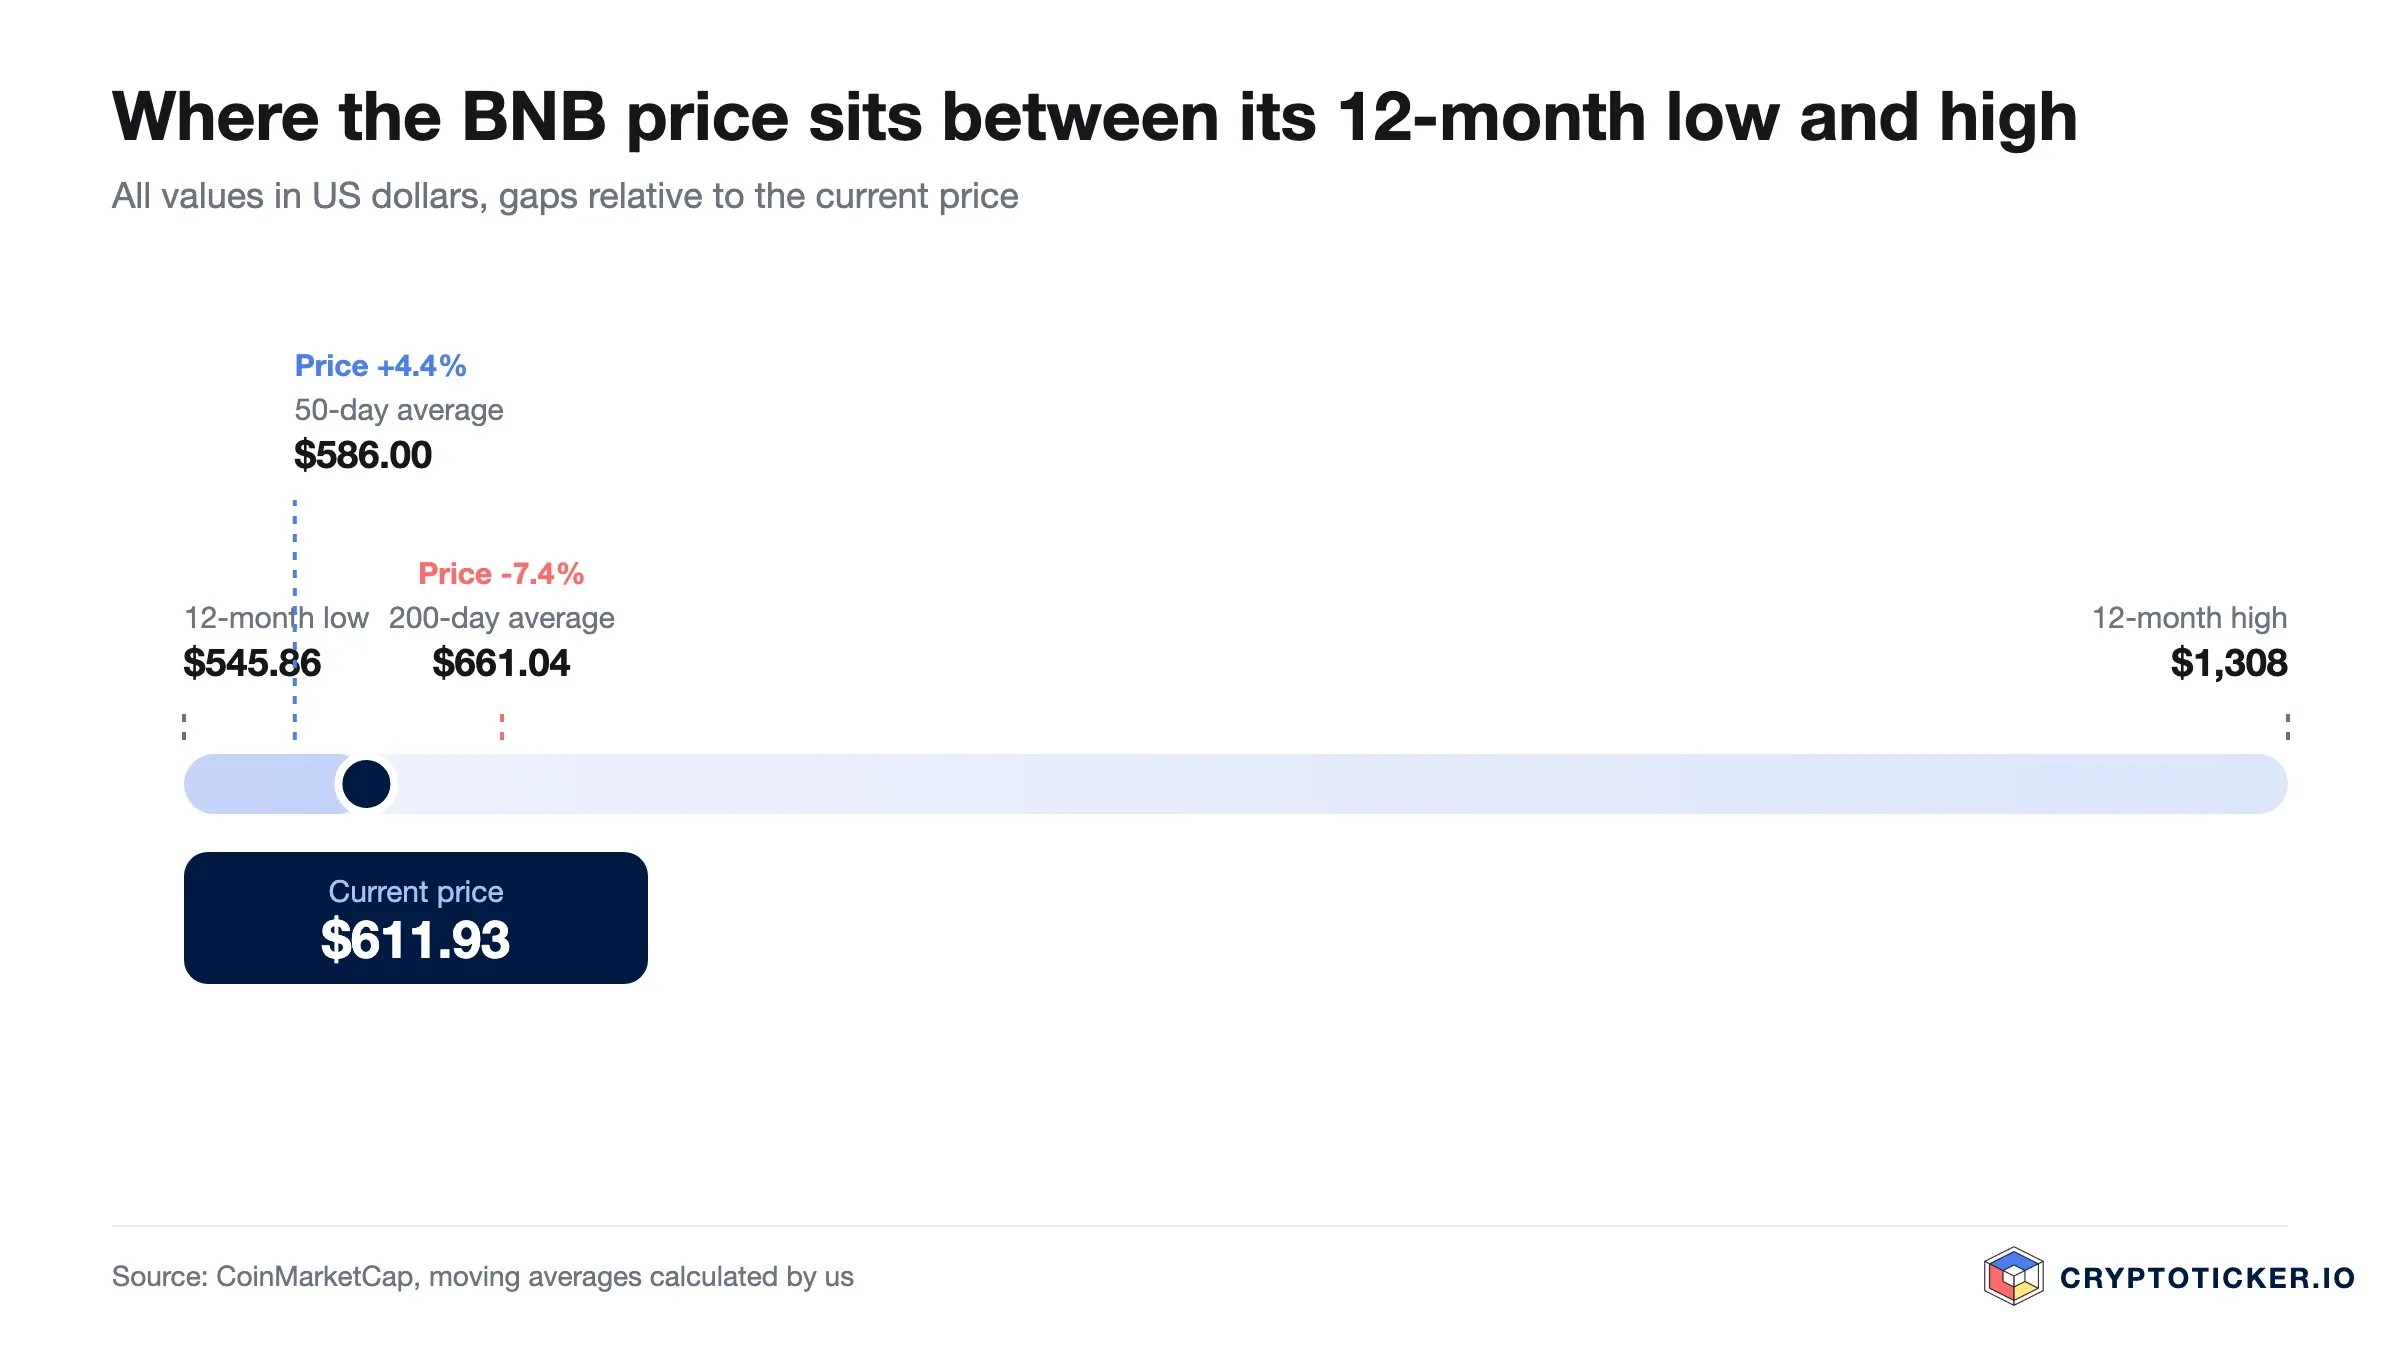
$BNB trades at 611.93 US dollars on 11 August 2026, 53.2 per cent below the twelve-month high of 1,307.76 dollars from 9 October 2025 and 12.1 per cent above the twelve-month low of 545.86 dollars from 1 July 2026. The coin has recovered from its summer low without coming near the levels of last autumn. The question here is a narrow one: what does the current price say about an entry today, and what would have to happen for that reading to be wrong?
The price data used here was collected by cryptoticker.io on 11 August 2026 from the public market data interface of CoinGecko. We use daily closing prices over the past 365 days and calculate the moving averages and the relative strength index ourselves, applying the standard formulas (RSI after Wilder, 14 periods). One caveat belongs in the open: the volume series contains nine implausible daily values between 2 and 10 April 2026, orders of magnitude above the normal level. Those nine days were excluded from every twelve-month volume comparison below; the seven-day and thirty-day windows fall outside that period and are unaffected.
$BNB price analysis: where the $BNB price stands right now
Three marks frame the current $BNB price. The first is the twelve-month low at 545.86 dollars, reached on 1 July 2026 and not tested since. The second is the 50-day exponential moving average at 586.82 dollars, which the price reclaimed during the July recovery and has held. The third is the 200-day exponential moving average at 661.04 dollars, 7.4 per cent above the current price, which has capped every recovery attempt this year.
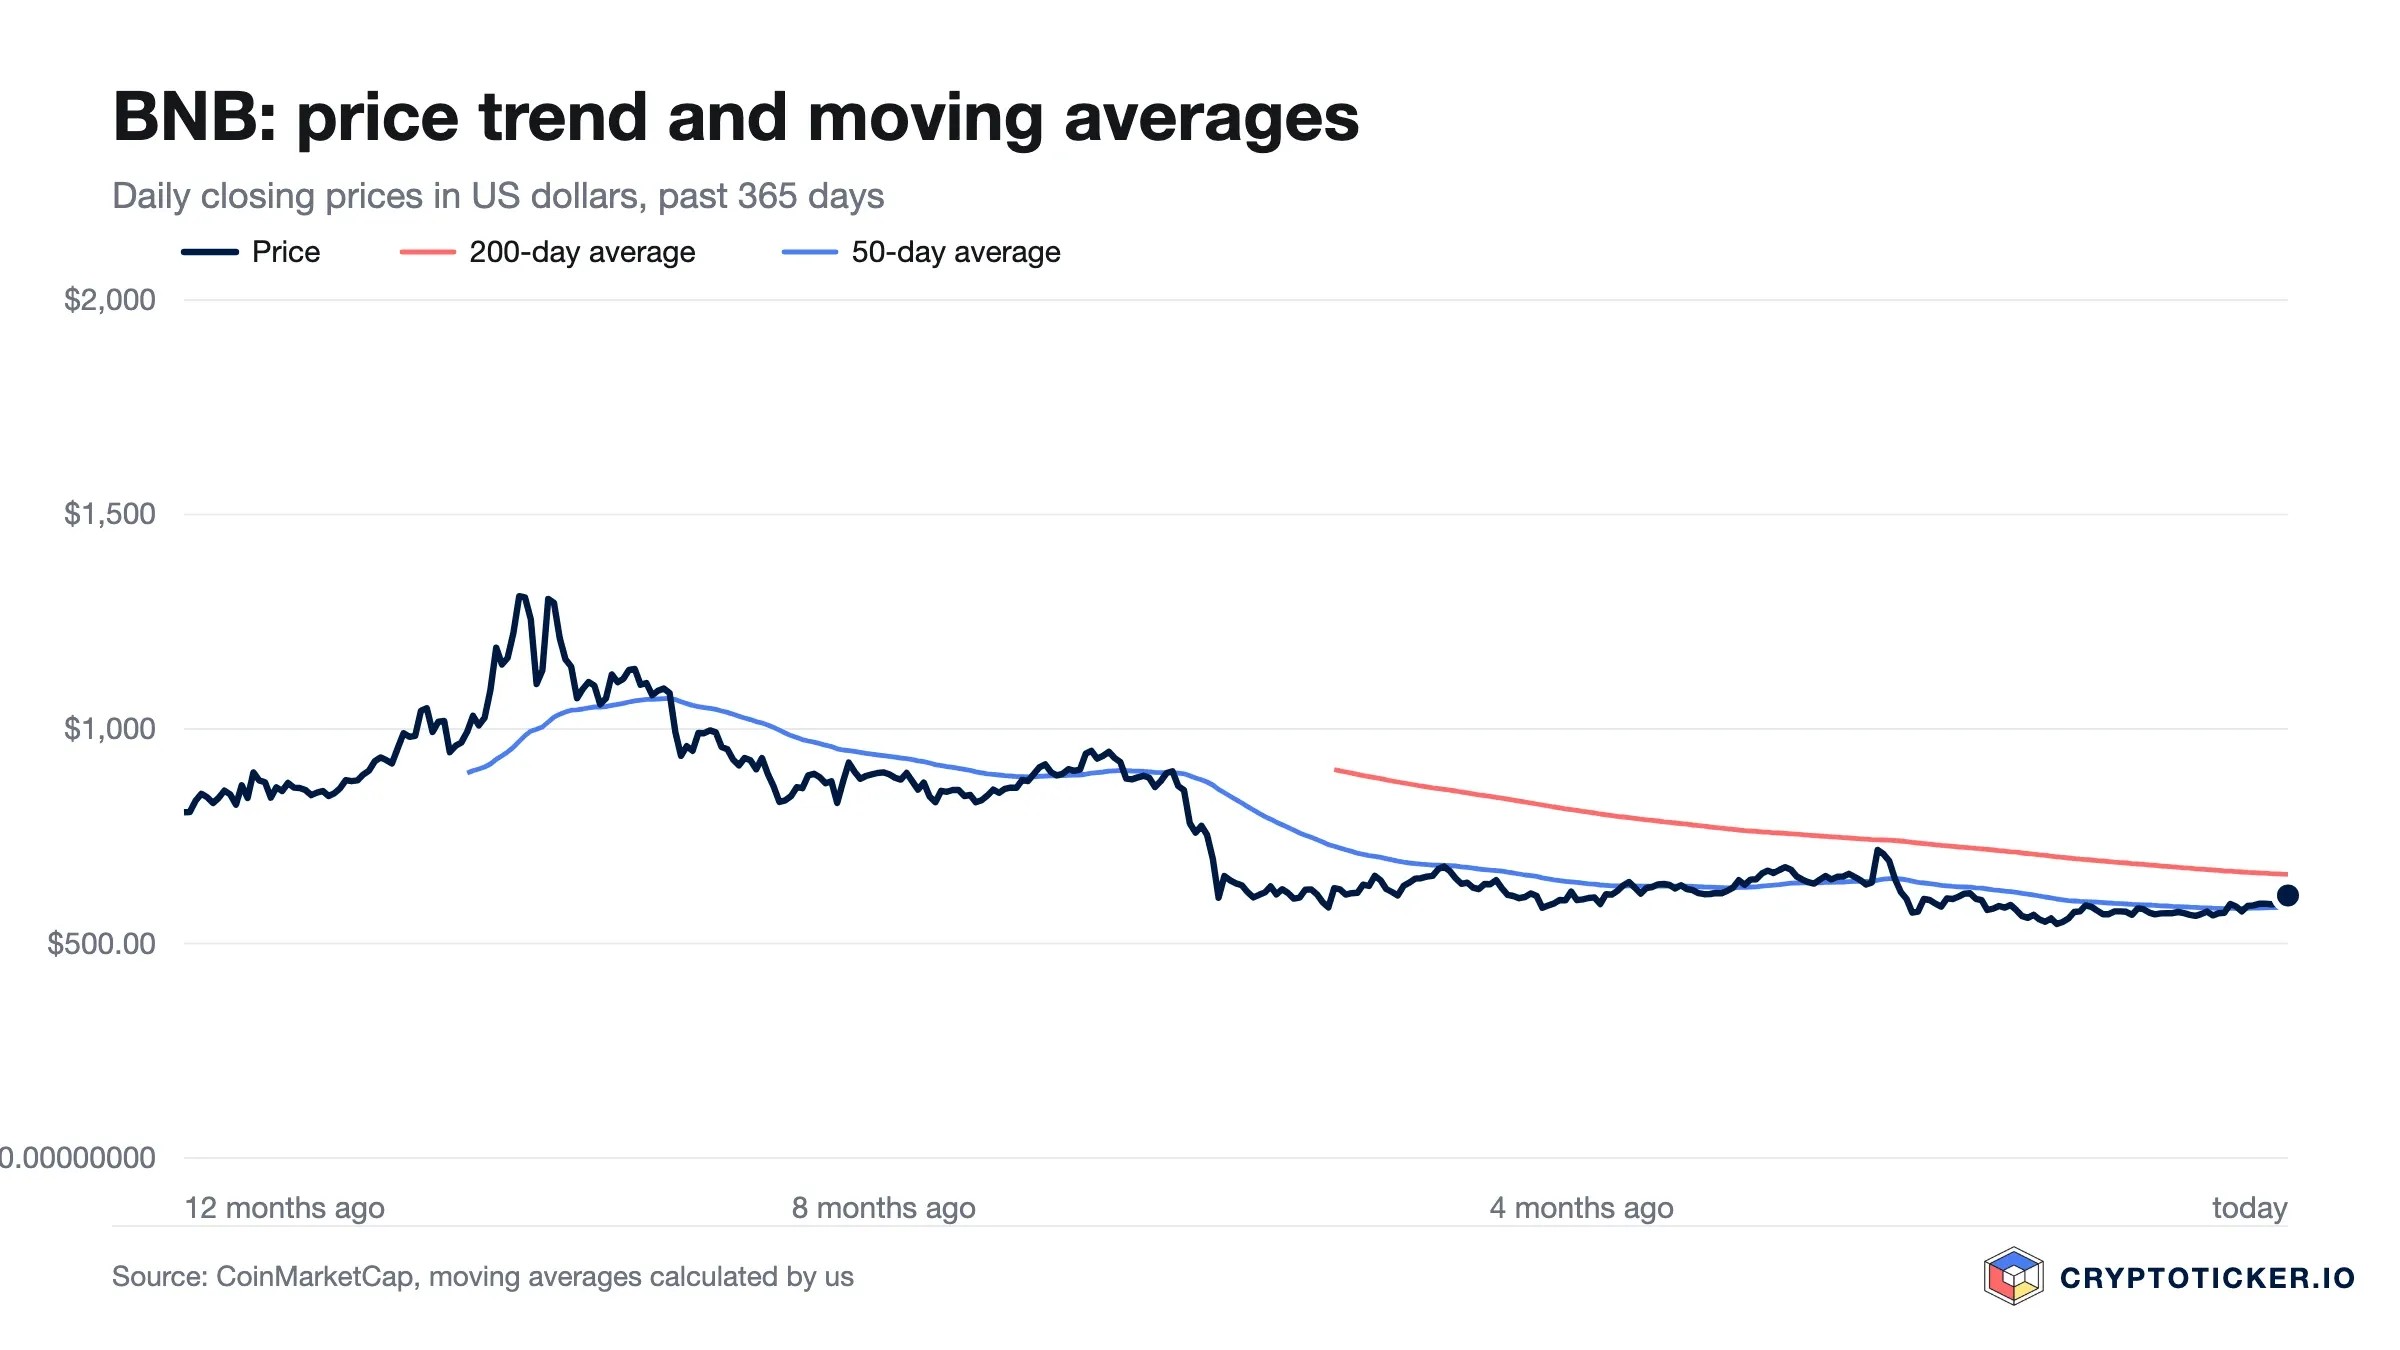
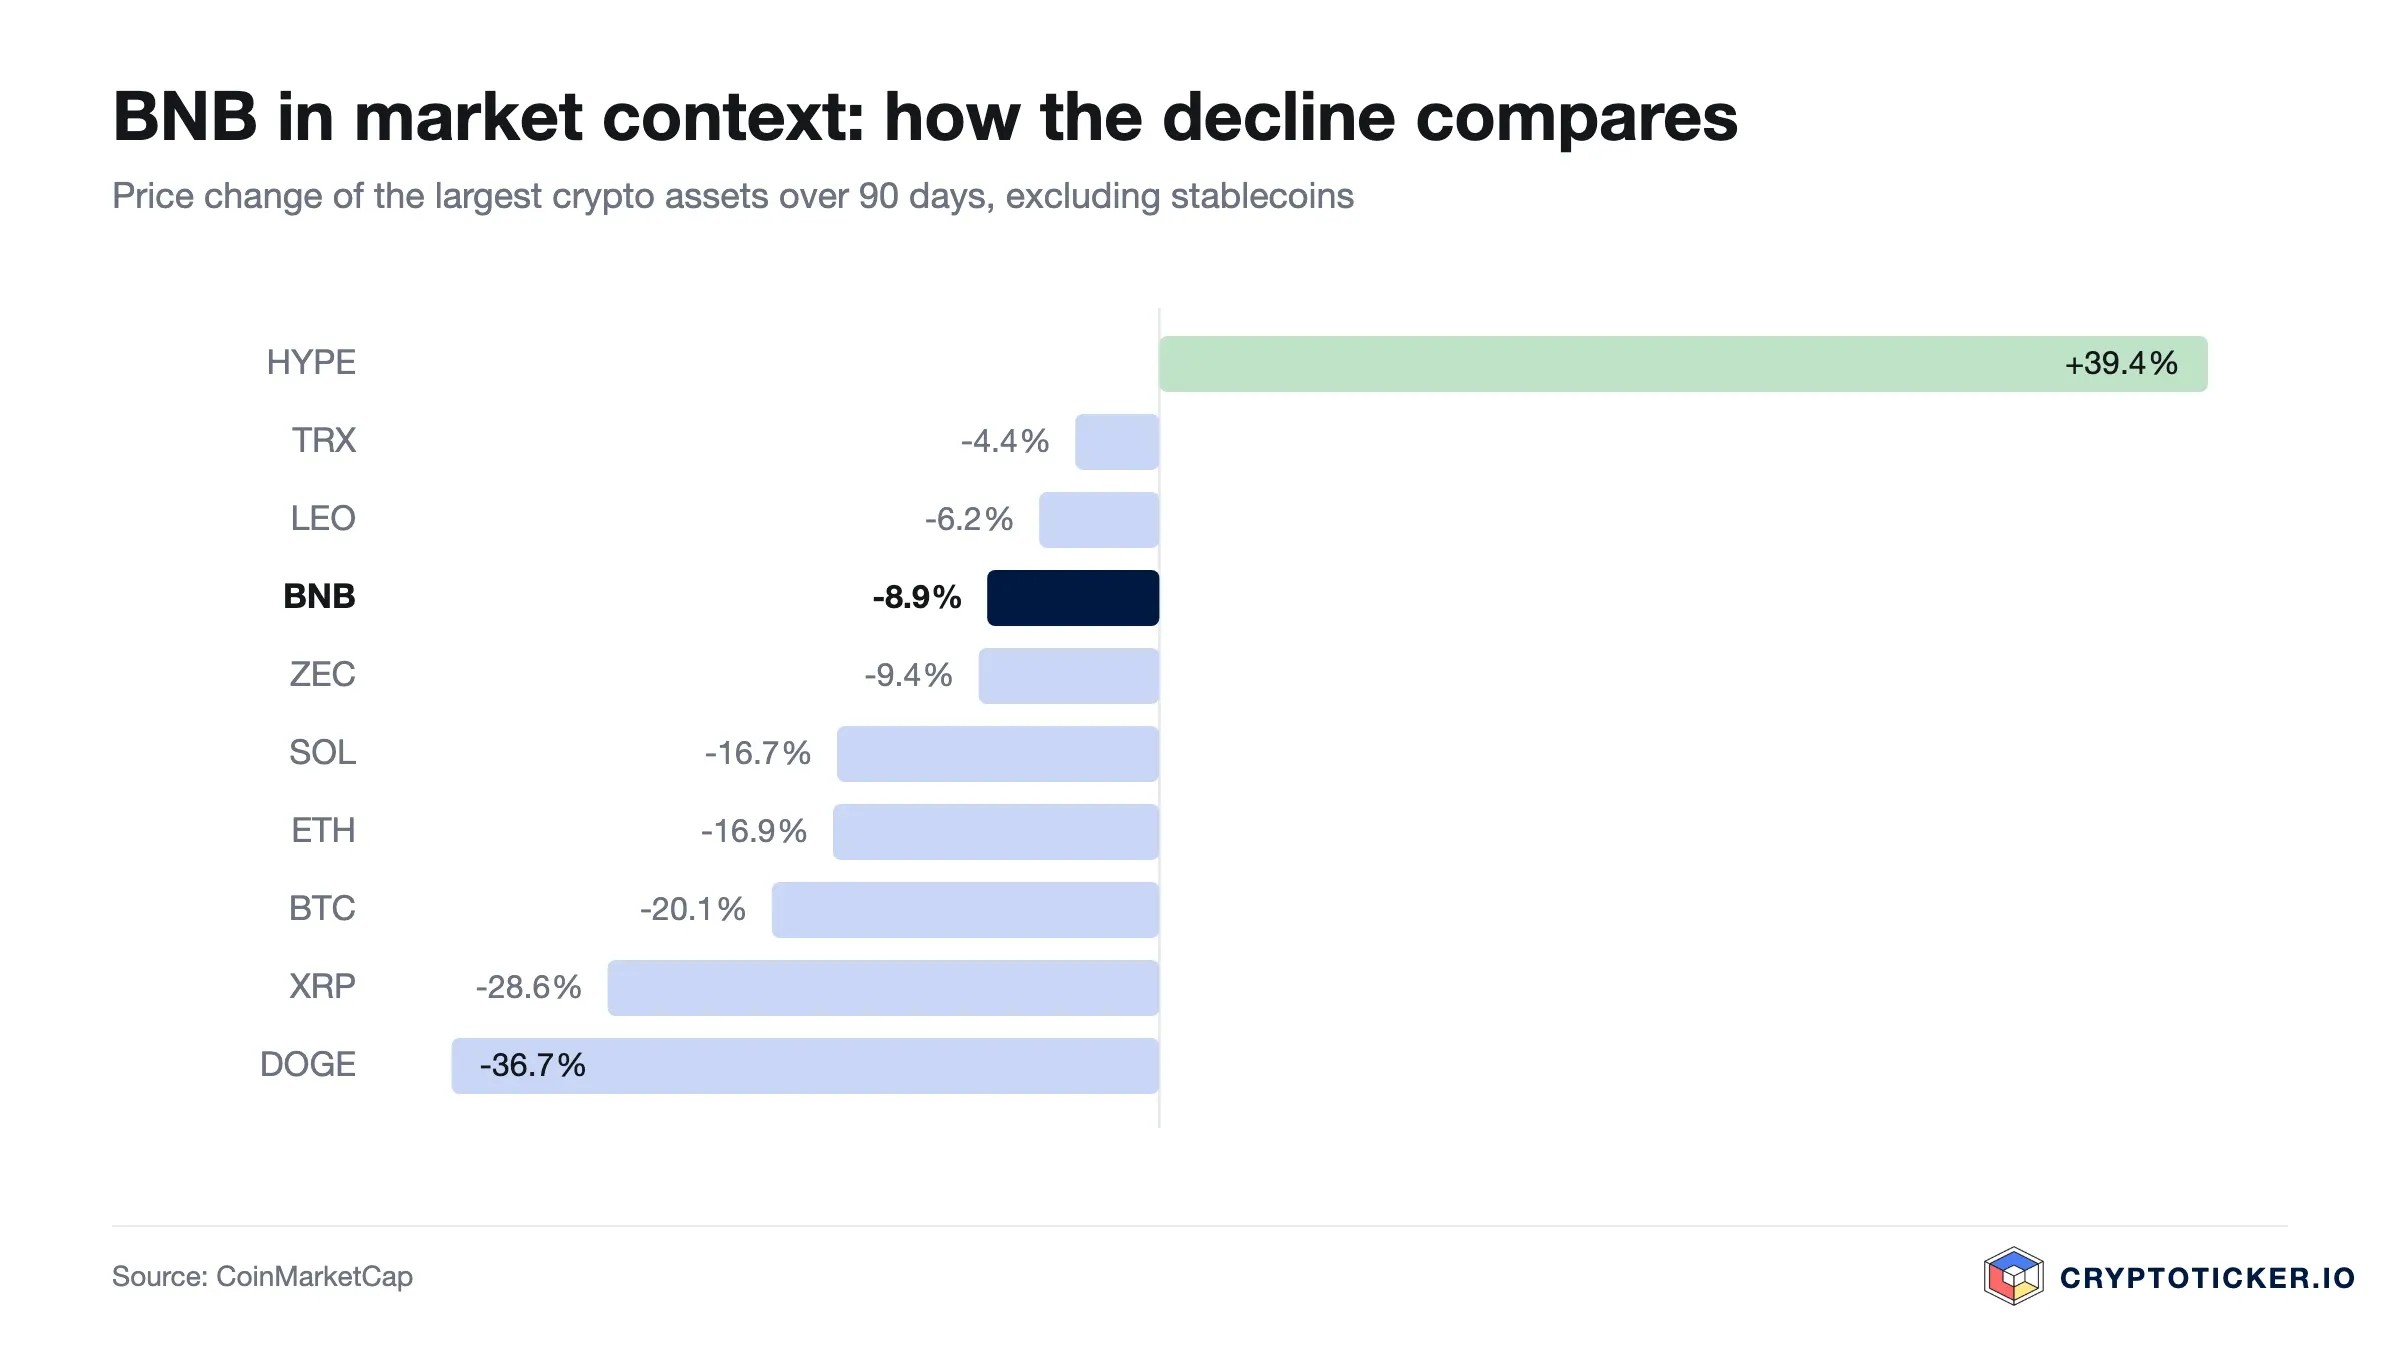
That puts $BNB in the zone between the short-term and the long-term average, the least conclusive part of any chart, because both camps can point to something. Buyers have the weeks spent above the 50-day line. Sellers have the 200-day line, which still runs above the price and still slopes downward. Over 30 days $BNB has gained 6.7 per cent, over 90 days it has lost 8.9 per cent, and over the full year it is down 26.6 per cent. The recovery is real and it is small relative to what came before it.
With a market capitalisation of about 81.5 billion dollars and a circulating supply of roughly 133.2 million $BNB, derived from capitalisation and price on the same day, $BNB remains one of the largest assets in the market. Size changes what a recovery has to look like: a coin of this weight does not double on order flow alone. Our $BNB price prediction tracks the marks that follow from here.
Is the $BNB downtrend broken or only interrupted?
A downtrend ends when the price sets a higher low and then takes out the previous high. $BNB has completed the first half of that and not the second. The low from 1 July at 545.86 dollars has held. What is missing is a daily close above the 200-day average at 661.04 dollars that survives more than a few sessions.
The distinction decides the entry question. If the trend is only interrupted, the current zone is a pause inside a movement that continues downward, and a purchase here is a purchase into a counter-trend rally. If the trend is broken, the same zone is the base of the next move and the 200-day line becomes a target rather than a ceiling. From the chart alone both readings stay open, though the evidence leans slightly towards the second: the price is holding a higher low, but on thin volume, and thin volume is the weaker form of support.
From our point of view the most plausible interpretation is a base that forms slowly and may fail more than once before it holds. That is an assessment rather than a fact, and it is testable: several daily closes below 545.86 dollars would mean the higher low did not hold.
What RSI and moving averages mean for a $BNB entry
The relative strength index over 14 days stands at 66.7, in the upper third of the range and close to the threshold of 70 that is conventionally read as overbought. It is the most awkward number for anyone considering an entry today, because it says the recent move has already used up part of the short-term momentum. Buying into an RSI near 70 means buying after the easy part of a recovery.
The two averages tell the longer story. The price sits 4.3 per cent above the 50-day line and 7.4 per cent below the 200-day line, so the short-term trend has turned while the long-term trend has not. That constellation resolves in one of two ways: either the price works through the 200-day line and the long-term average follows, or the short-term average rolls over and joins the longer one. Nothing in the current data settles which applies here.
For an entry this is a question of timing rather than conviction. An RSI at 66.7 argues against buying the full position at once, and it says nothing about whether $BNB is worth owning at all.
What trading volume reveals about demand for $BNB
Volume gives the least comfort in this picture. Over the past seven days $BNB traded an average of 586 million dollars per day against 555 million over 30 days, an increase of 5.6 per cent. Measured against the cleaned twelve-month median of 976 million dollars per day, current volume runs around 40 per cent lower.
That reading is uncomfortable for a bullish case. The July recovery happened because sellers stepped back, not because buyers arrived in force. The two produce the same line on a chart and very different foundations underneath it. A price that rises on falling volume gives back its gains more readily, because less capital is committed at the higher level.
It is also the cleanest early indicator to watch. If volume moves back towards the twelve-month median while the price holds above the 50-day average, the recovery gains a foundation it currently lacks. If the price approaches the 200-day line on volume like today's, a failed test is the likelier outcome.
Structural factors that speak for $BNB beyond the chart
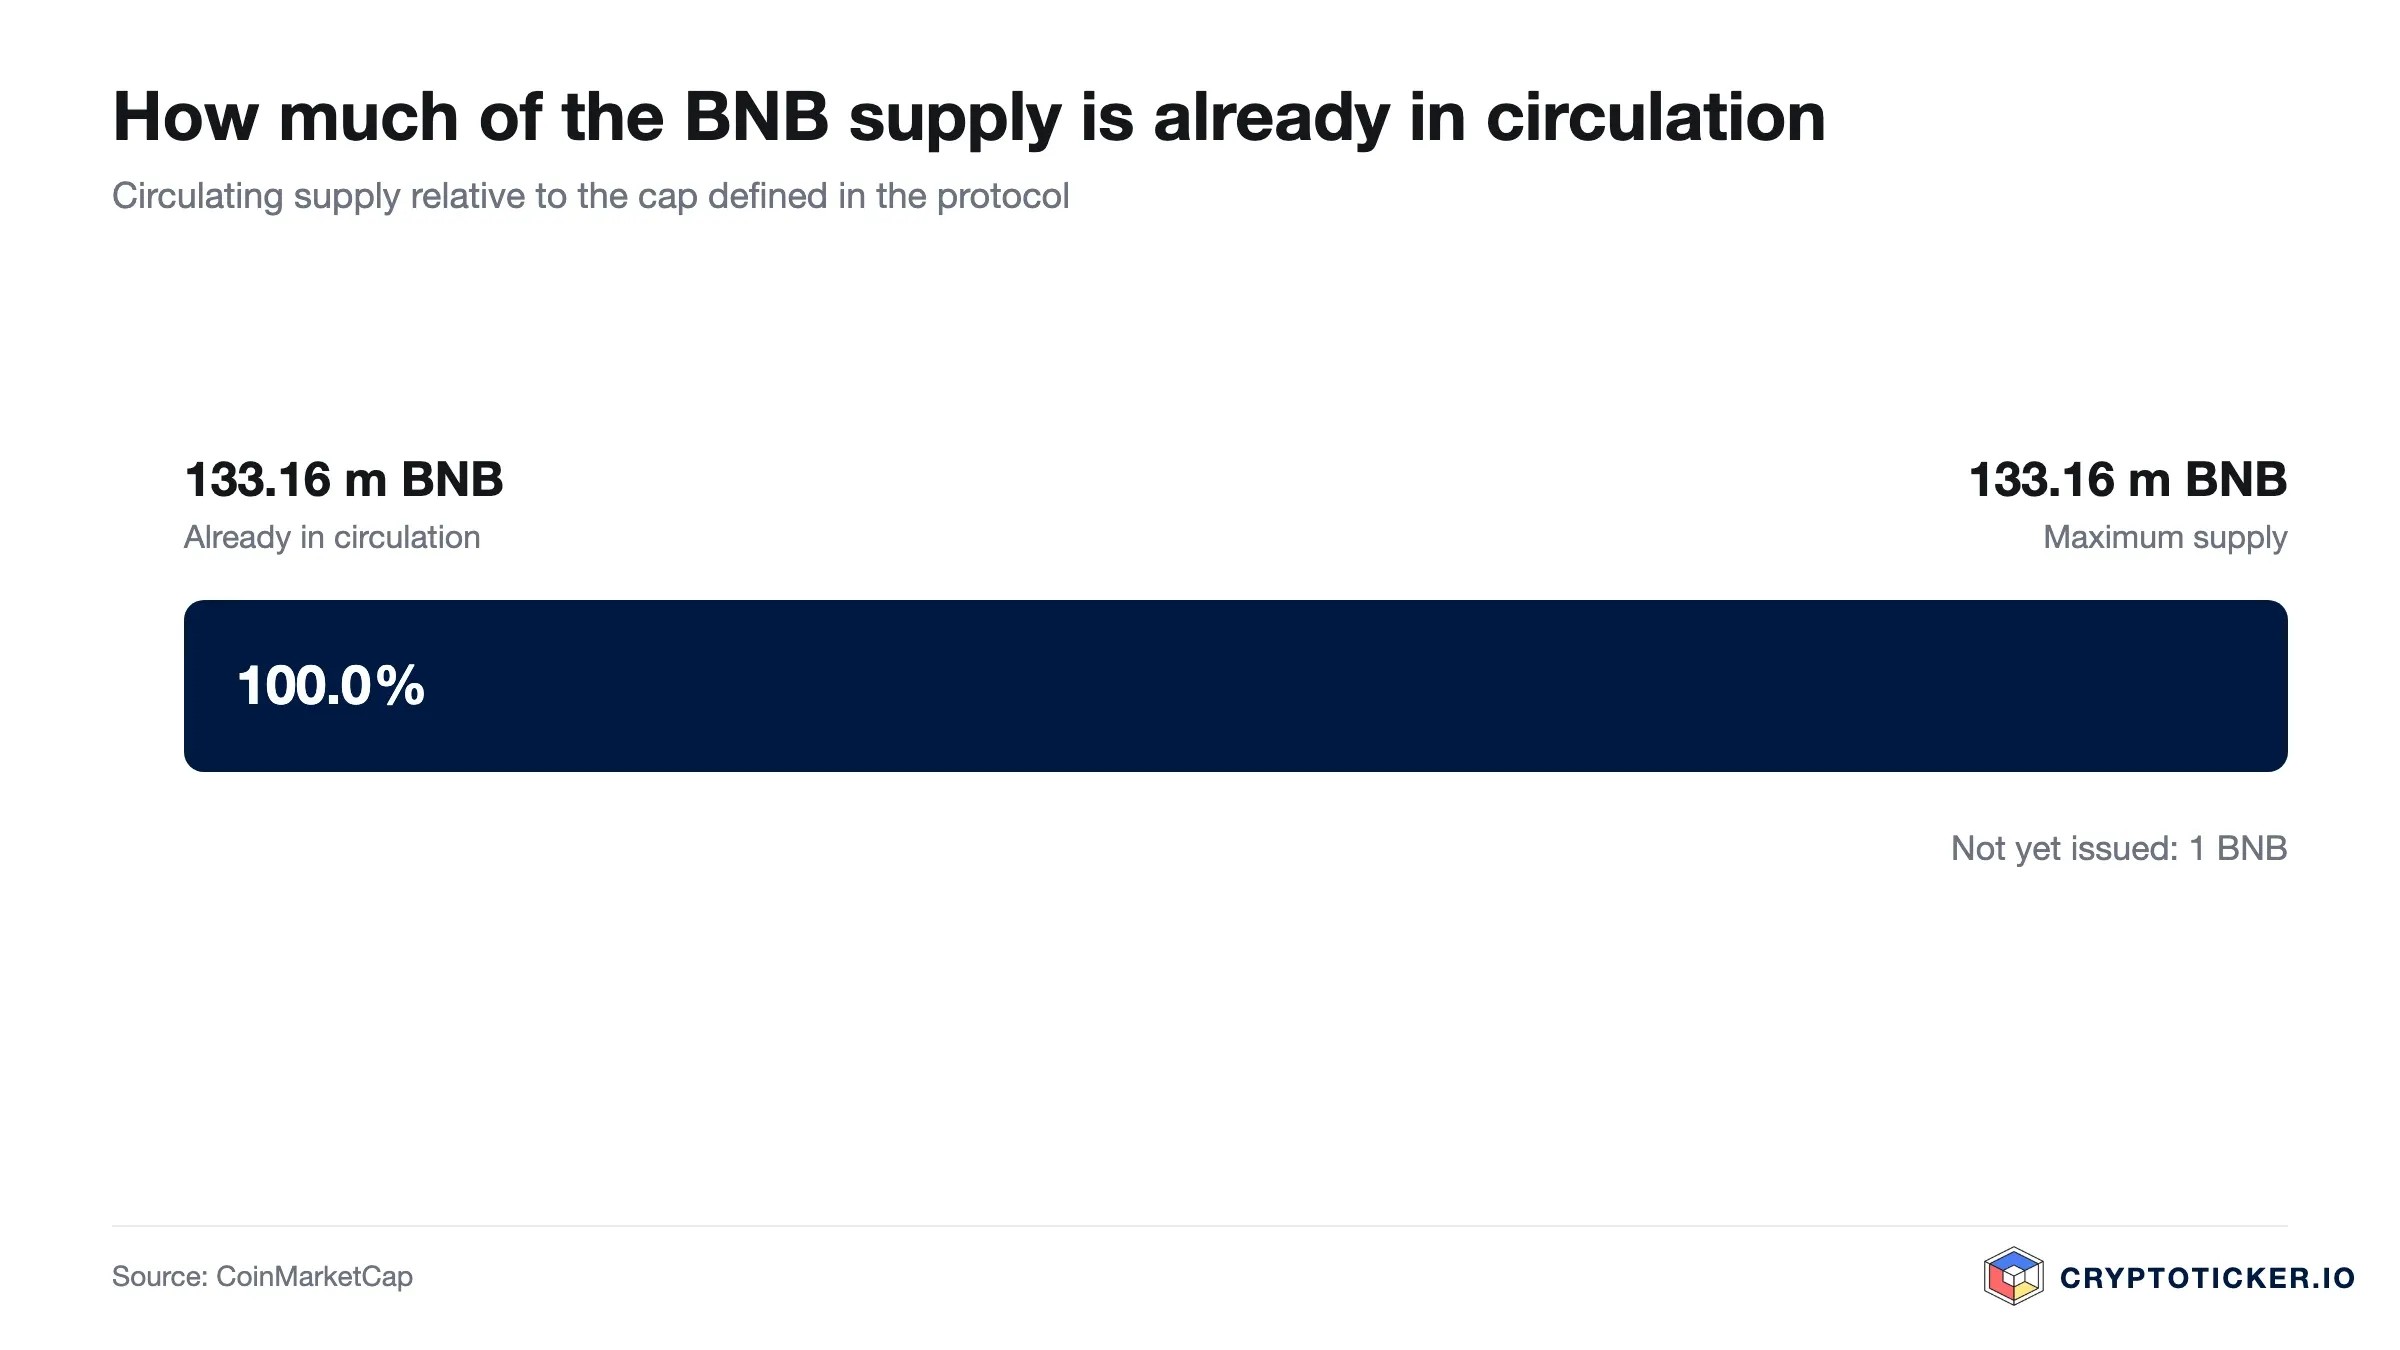
Three structural points sit apart from the chart. The first is supply: $BNB's circulating supply stands at roughly 133.2 million tokens and has been reduced over years through a documented burn mechanism, which distinguishes it from assets with open-ended issuance. Shrinking supply does not create demand, but it removes a headwind that weighs on inflationary coins.
The second is usage. $BNB is the fee token of $BNB Chain, so demand is tied to activity on that chain rather than to sentiment alone. The technical basis is public in the $BNB Smart Chain documentation, and the mechanism through which validators secure the network is set out in the staking overview.
The third is regulation, and it cuts both ways. $BNB's utility is closely tied to one exchange group and one chain, which makes it more sensitive to regulatory change than a broadly distributed asset. In the European Union the framework for crypto asset services is set by the European Securities and Markets Authority, whose published material at ESMA is the primary source for what applies to providers here. For holders the practical consequence is that access conditions can change without the chart moving first.
What speaks for buying $BNB at current prices
Three points make the constructive case, stated precisely rather than generously.
First, the price is holding above the 50-day average. After a year in which $BNB lost 26.6 per cent, the short-term trend has turned upward and stayed there through several weeks of trading. That is the minimum precondition for any recovery, and it is currently met.
Second, the distance to the twelve-month high is large. At 53.2 per cent below the October 2025 peak, a buyer today pays roughly half of what a buyer paid ten months ago for the same asset with the same supply mechanism. Whether that is cheap depends on what the network is worth; the discount to recent history is a fact rather than a view.
Third, the structural coupling described above is intact. $BNB's demand comes from an operating network with fee revenue and staking rather than from expectations alone. Among large-cap assets that trait is less common than the capitalisation table suggests.
What speaks against buying $BNB at current prices
Three points make the case against, and today they carry more weight than the constructive ones.
First, volume. At around 40 per cent below the cleaned twelve-month median, the recovery lacks participation, and a move that few are trading reverses cheaply.
Second, the RSI at 66.7. Short-term momentum has largely been spent, so an entry here buys into the later part of a move and raises the probability of an immediate drawdown even if the longer-term reading proves right.
Third, the 200-day average at 661.04 dollars still runs above the price and still falls. Every recovery attempt this year has stopped at or below that line, so until a close above it holds, the burden of proof stays with the buyers.
How to buy $BNB at current prices: costs, custody and providers
Three things determine what an entry actually costs. The first is the trading fee, which varies between providers by more than most buyers assume on small positions. The second is the spread, often the larger cost at retail order sizes and rarely advertised. The third is withdrawal: whether the provider lets you move $BNB to your own wallet, and what that transfer costs.
For the venues themselves, our crypto exchange comparison sets fees and features side by side, and the overview of regulated exchanges is the more relevant one if supervision within the EU is your priority. Individual venues are assessed in our Binance review, the Kraken review and the Bitpanda review.
Custody is the decision most buyers postpone. Coins left on an exchange stay under that provider's control, which is convenient and carries counterparty risk; coins in your own wallet remove that risk and hand you full responsibility for the keys. Our hardware wallet comparison covers the devices for the second route.
Is $BNB a good buy at current prices, short term and long term
Short term, the data argues for patience rather than purchase. The RSI at 66.7 sits near the overbought threshold, volume runs 40 per cent below the twelve-month median, and the 200-day average at 661.04 dollars remains untested from below. A buyer entering today pays for a recovery the market has not confirmed with participation. As a defined condition rather than a general view: a daily close above 661.04 dollars on volume near the twelve-month median would change the short-term picture.
Long term, the assessment is more open and does not depend on the chart. It depends on whether $BNB Chain keeps generating activity, whether the burn mechanism continues to reduce supply, and whether regulatory conditions in the major markets stay workable for the exchange group the token is tied to. If those three hold, the current level looks reasonable in retrospect; if one fails, the chart will not have warned you in time.
None of this is a recommendation to buy or to stay out. It describes the conditions under which the reading above stands and those under which it fails. Our assumption of a slowly forming base is refuted by several daily closes below 545.86 dollars and confirmed by a sustained close above the 200-day average on volume that has returned.
What to take away from this $BNB analysis
- $BNB has reclaimed its 50-day average but remains 7.4 per cent below the 200-day line, so the short-term trend has turned while the long-term trend has not. The marks that follow are tracked in our $BNB price prediction.
- Volume is the weak point: around 40 per cent below the cleaned twelve-month median, the recovery rests on absent sellers rather than arriving buyers. If you buy anyway, the venue determines the cost, which our crypto exchange comparison sets out.
- An RSI of 66.7 argues against entering the full position at once. For anything held beyond the next move, custody deserves its own decision, covered in our hardware wallet comparison.
Disclosure: Some of the providers mentioned in this article work with us through partner programmes. This has no influence on the price analysis or on our assessment of the chart situation; the price data comes from a public market data source and can be verified there.
(As of 11 August 2026. This article is not investment advice. Prices, fees and conditions change; check them with the provider before every purchase. Crypto assets are subject to high price volatility, and a total loss is possible.)
Transparency note: This article was produced with the assistance of artificial intelligence and reviewed by our editorial team before publication. All figures and claims were checked against the primary sources linked in the text. The feature image was generated with AI.