
 ambcrypto.com

$SKYAI [$SKYAI] has declined sharply over the past week, resulting in a loss of roughly 29%, although its weekly performance remains positive.
The market outlook, however, suggests that the seemingly bullish asset could be heading for further downside in the near term. Selling pressure is building, and traders may need to prepare for another decline before the next rebound.
The market is finding true value
$SKYAI’s decline over the past couple of days came after the asset moved into the overvalued zone of the Bollinger Bands.
The overvalued zone, marked in red, is an area where selling pressure can increase after the price moves significantly above its recent range.
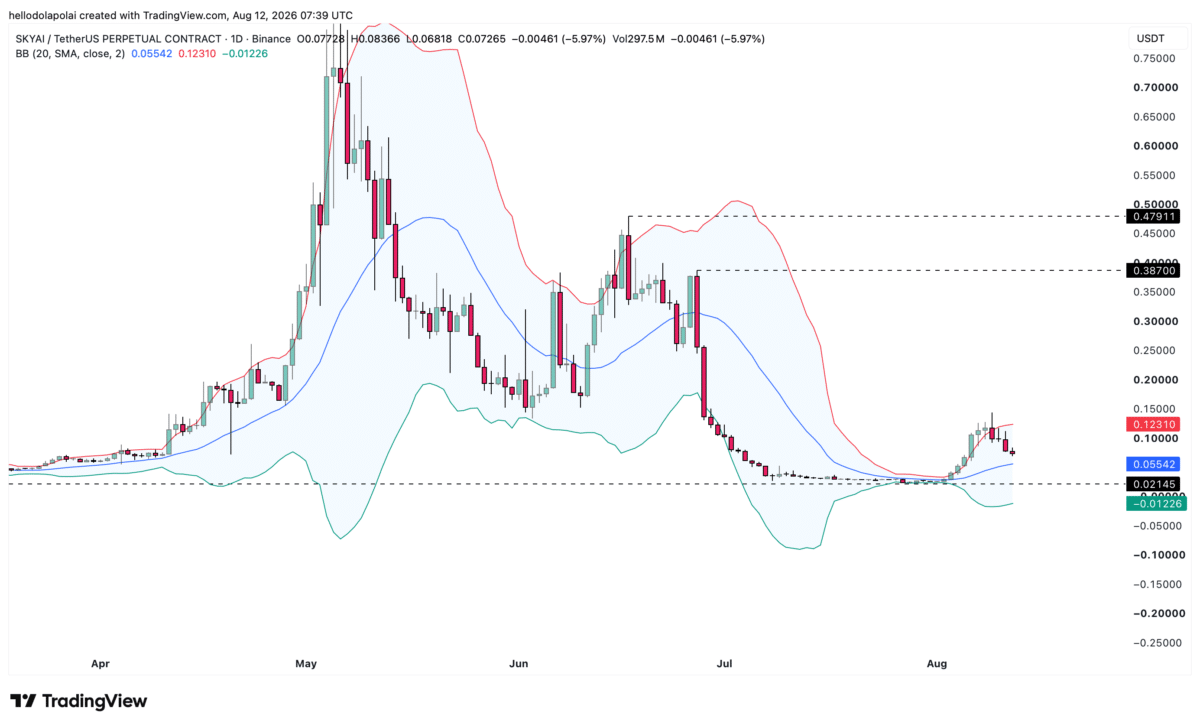
The rejection from that level suggests that the price is now moving back toward a more balanced level on the chart.
Using the Bollinger middle band as a possible reset zone, the price could find support around $0.055, marked by the blue level. This suggests that there could still be more downside before $SKYAI finds support.
If bearish sentiment continues to grow, the price could fall further toward the lower Bollinger Band, marked in green, which would place the asset deeper into a negative zone.
More indicators turn negative
The indicators also point to the possibility of further downside, although a rebound remains possible.
The moving average ribbon, which combines the 20-day, 50-day, 100-day, and 200-day moving averages, shows that the longer-term averages remain above the shorter-term averages.
The 100-day and 200-day MAs are still above the short-term averages, suggesting that the broader trend remains bullish.
However, the shorter-term setup is becoming weaker. The 20-day and 50-day SMAs are moving toward a possible crossover, with the 50-day SMA at $0.07251 and the 20-day SMA at $0.05546. This does not confirm a rally, but it remains worth watching if a rebound occurs.
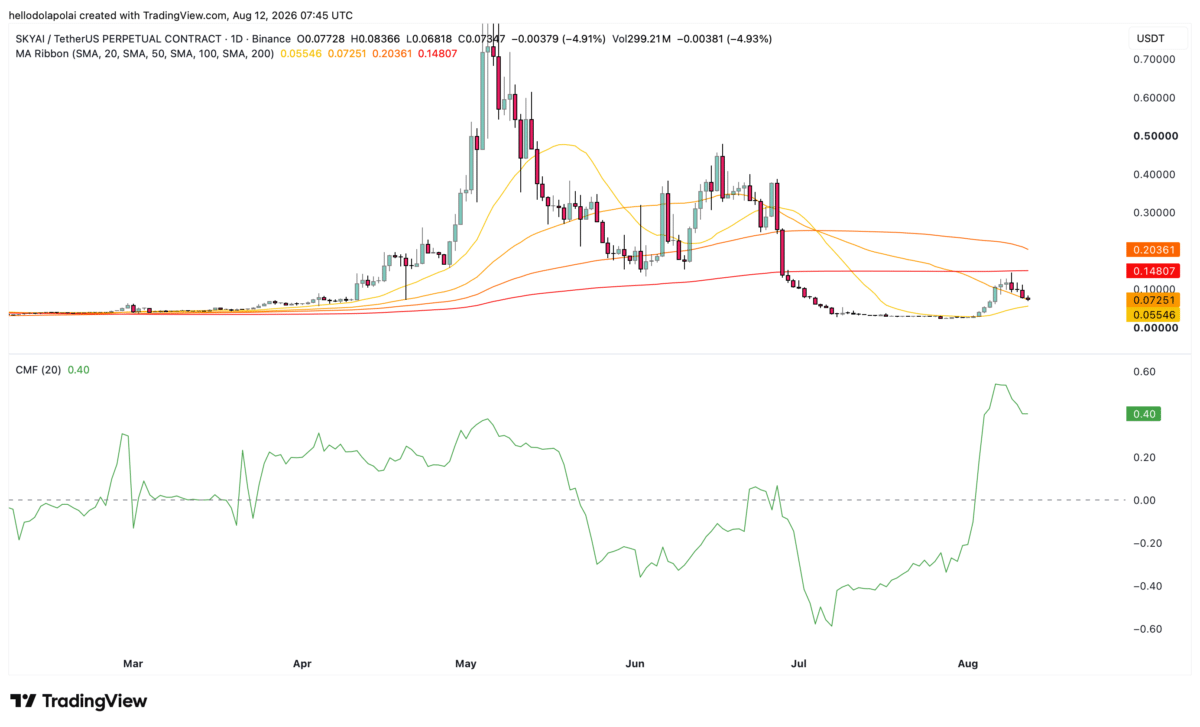
The Chaikin Money Flow (CMF), which measures buying and selling pressure based on price and volume, also remains positive at around 0.40.
Although the indicator has fallen from its previous high, its position above zero shows that buying pressure has not completely disappeared.
These indicators leave room for a rebound, but they do not remove the risk of further downside if selling pressure continues to increase.
$SKYAI Spot flow flops
Spot flows show that selling pressure in $SKYAI has continued for at least the past three days.
Cumulative netflow over the past three days shows roughly $245,000 worth of the asset being sold, with selling activity continuing into the most recent day.
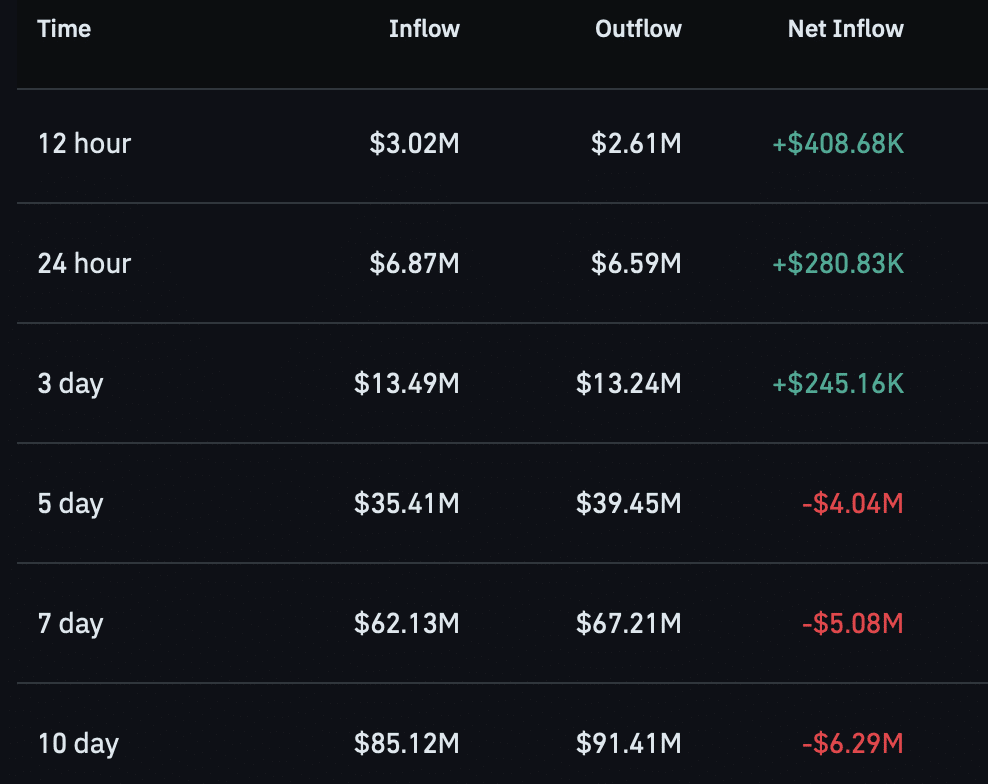
This marks a clear reversal from the accumulation seen between five and 10 days ago, when millions of dollars worth of $SKYAI were bought through the spot market.
If selling pressure continues to build, $SKYAI could see further downside before making another attempt at a rebound.
Final Summary
- $SKYAI has lost about 29% in the past day, with the Bollinger Bands and weakening short-term moving averages pointing to more downside.
- Spot flows have shifted from accumulation to selling, with roughly $245,000 in net outflows over three days.