
 cryptoticker.io
Litecoin trades at around 45.27 USD on 12 August 2026. That leaves the price 65.4 per cent below its 12-month high of 130.97 USD and only 10.8 per cent above its 12-month low of 40.85 USD. Anyone buying today is buying one of the oldest crypto assets close to its yearly floor. Is that an entry price or a trap?
The price data in this article was collected by cryptoticker.io on 12 August 2026. Market data comes from CoinMarketCap. We used 365 daily closing prices up to and including 11 August 2026 and calculated the moving averages, the relative strength index and the 12-month extremes ourselves, using the standard formulas: exponential smoothing for the averages and Wilder's method for the RSI. Every figure can be checked against the same source.
Litecoin price analysis: where the LTC price stands now
The Litecoin price sits at 45.27 USD, inside a zone it has barely left for weeks. Over seven days it moved by 1.0 per cent, and the daily closes of the past week ranged between 44.83 USD and 45.98 USD. That is a narrow band for a market accustomed to double-digit daily swings.
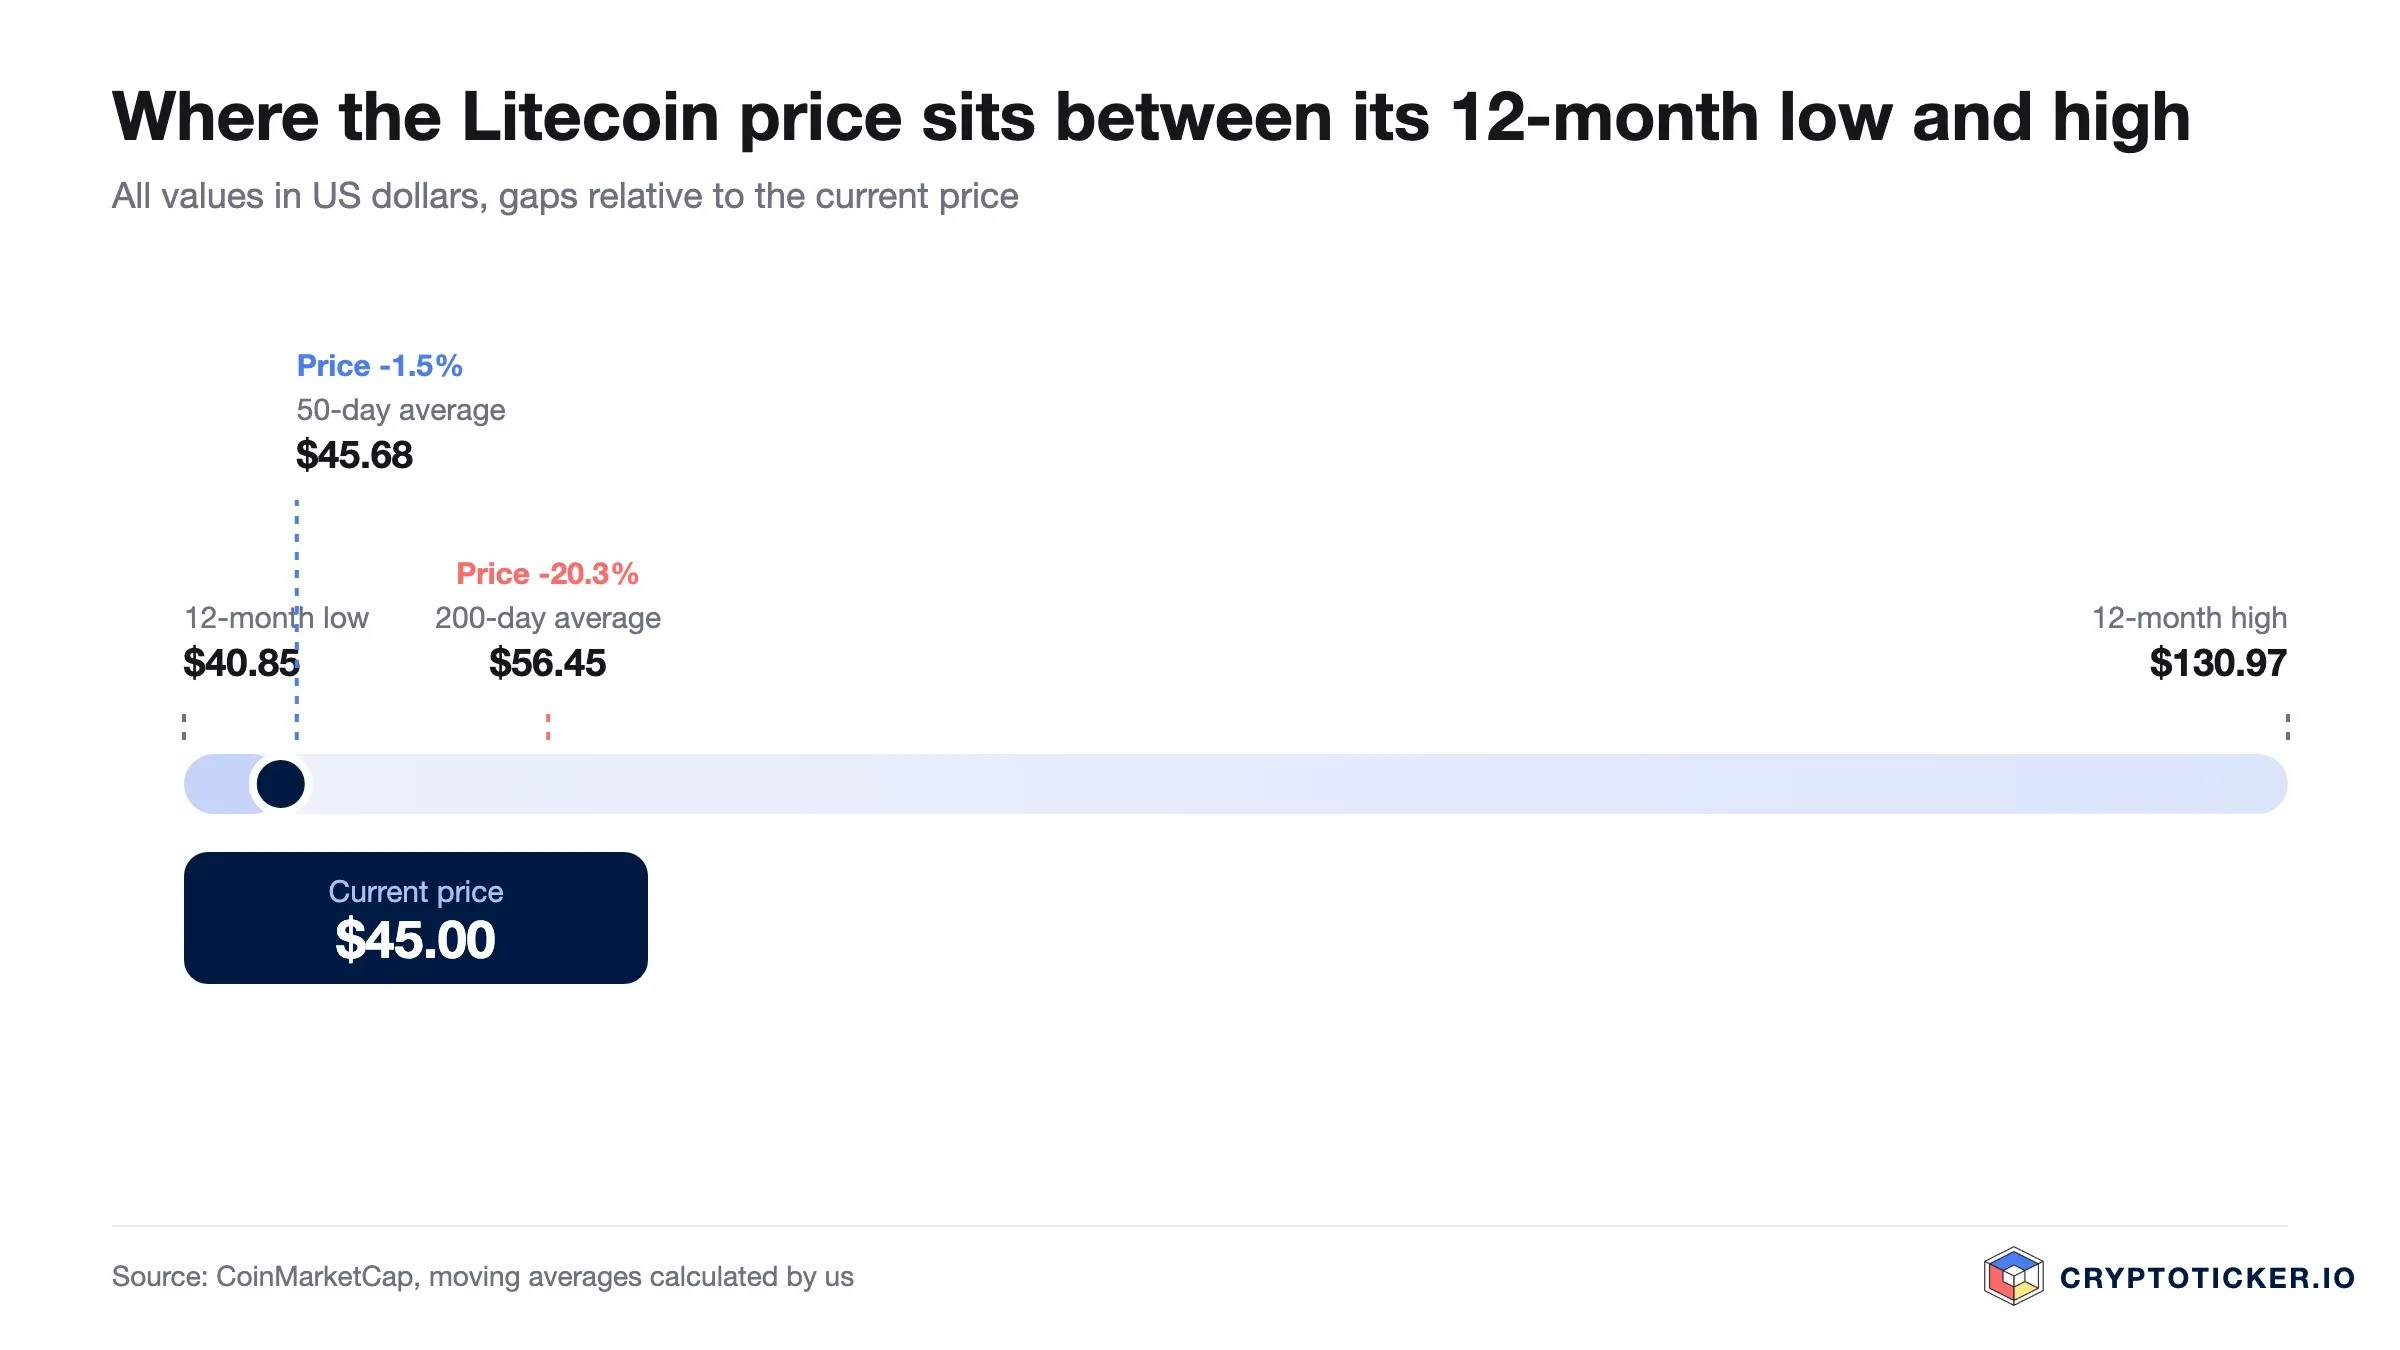
Three levels frame the situation. Support lies at the 12-month low of 40.85 USD from 26 June 2026, 10.8 per cent below the current price. The current zone is marked by the 50-day average at 45.68 USD, which the price is touching from below with a gap of 0.9 per cent. Above it sits the 200-day average at 56.45 USD, 19.8 per cent away. Between the two, the past twelve months show no meaningful resistance.
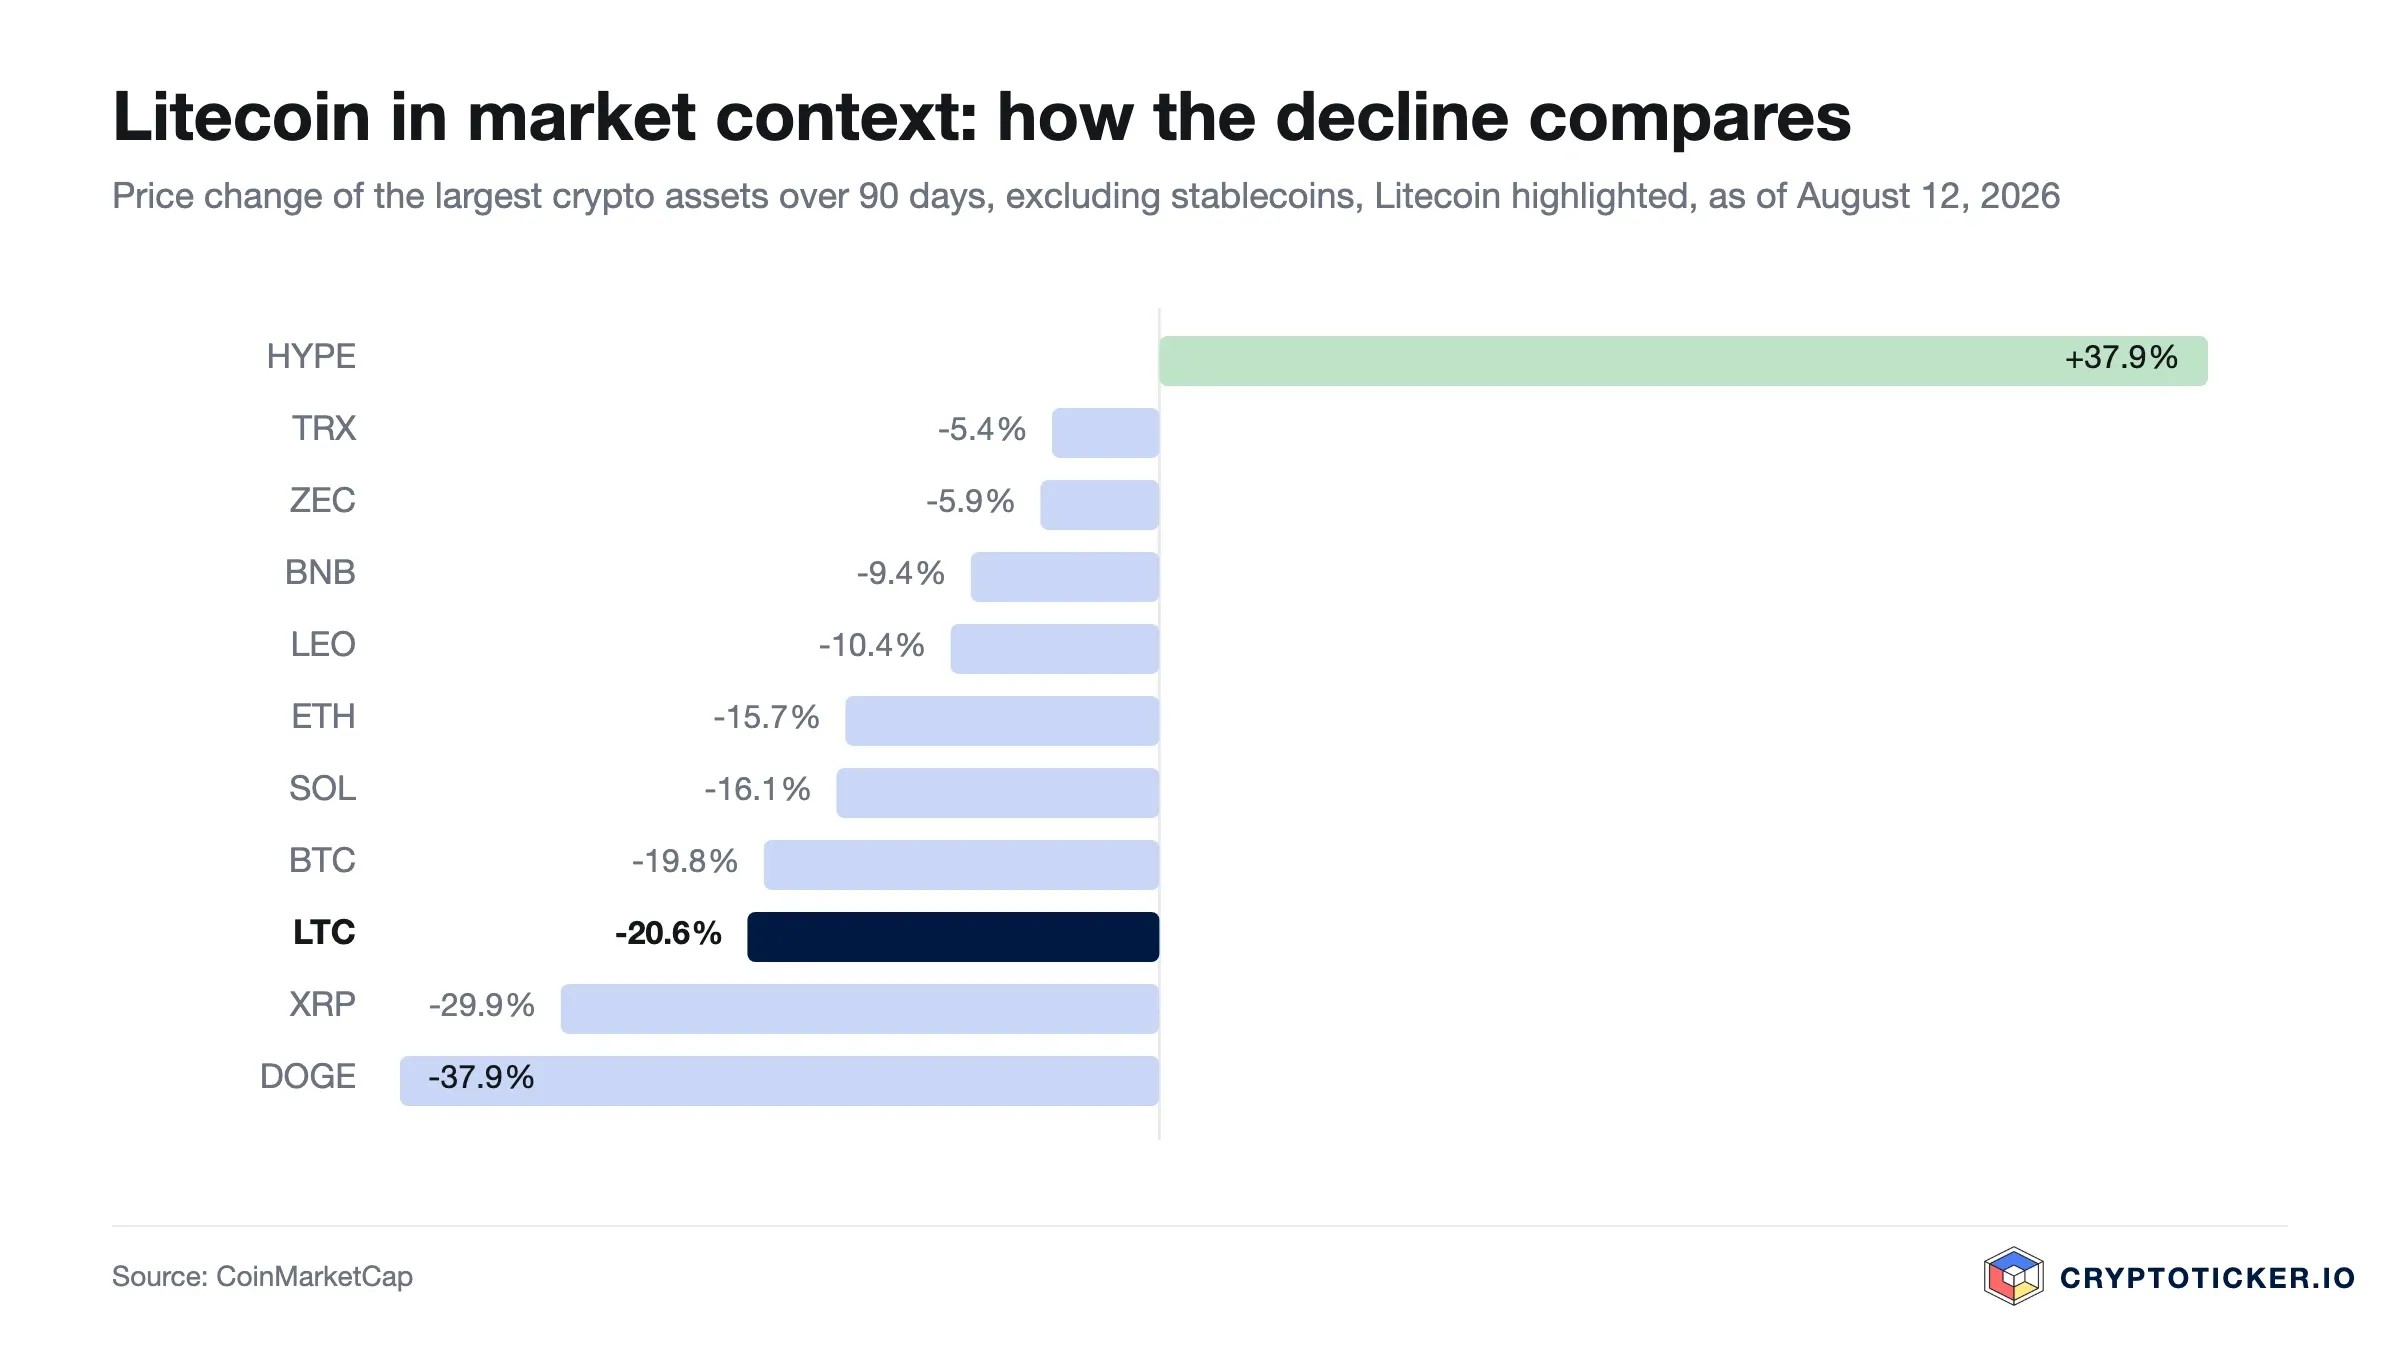
Over one year the price is down 62.4 per cent, over 90 days 20.5 per cent, while the past 30 days show a gain of 3.0 per cent. Downward pressure has eased without turning into a recovery. At roughly 3.51 billion USD in market capitalisation, Litecoin ranks 23rd among crypto assets. How that fits into longer-term scenarios is set out in our Litecoin price prediction.
Is the Litecoin downtrend broken or only interrupted?
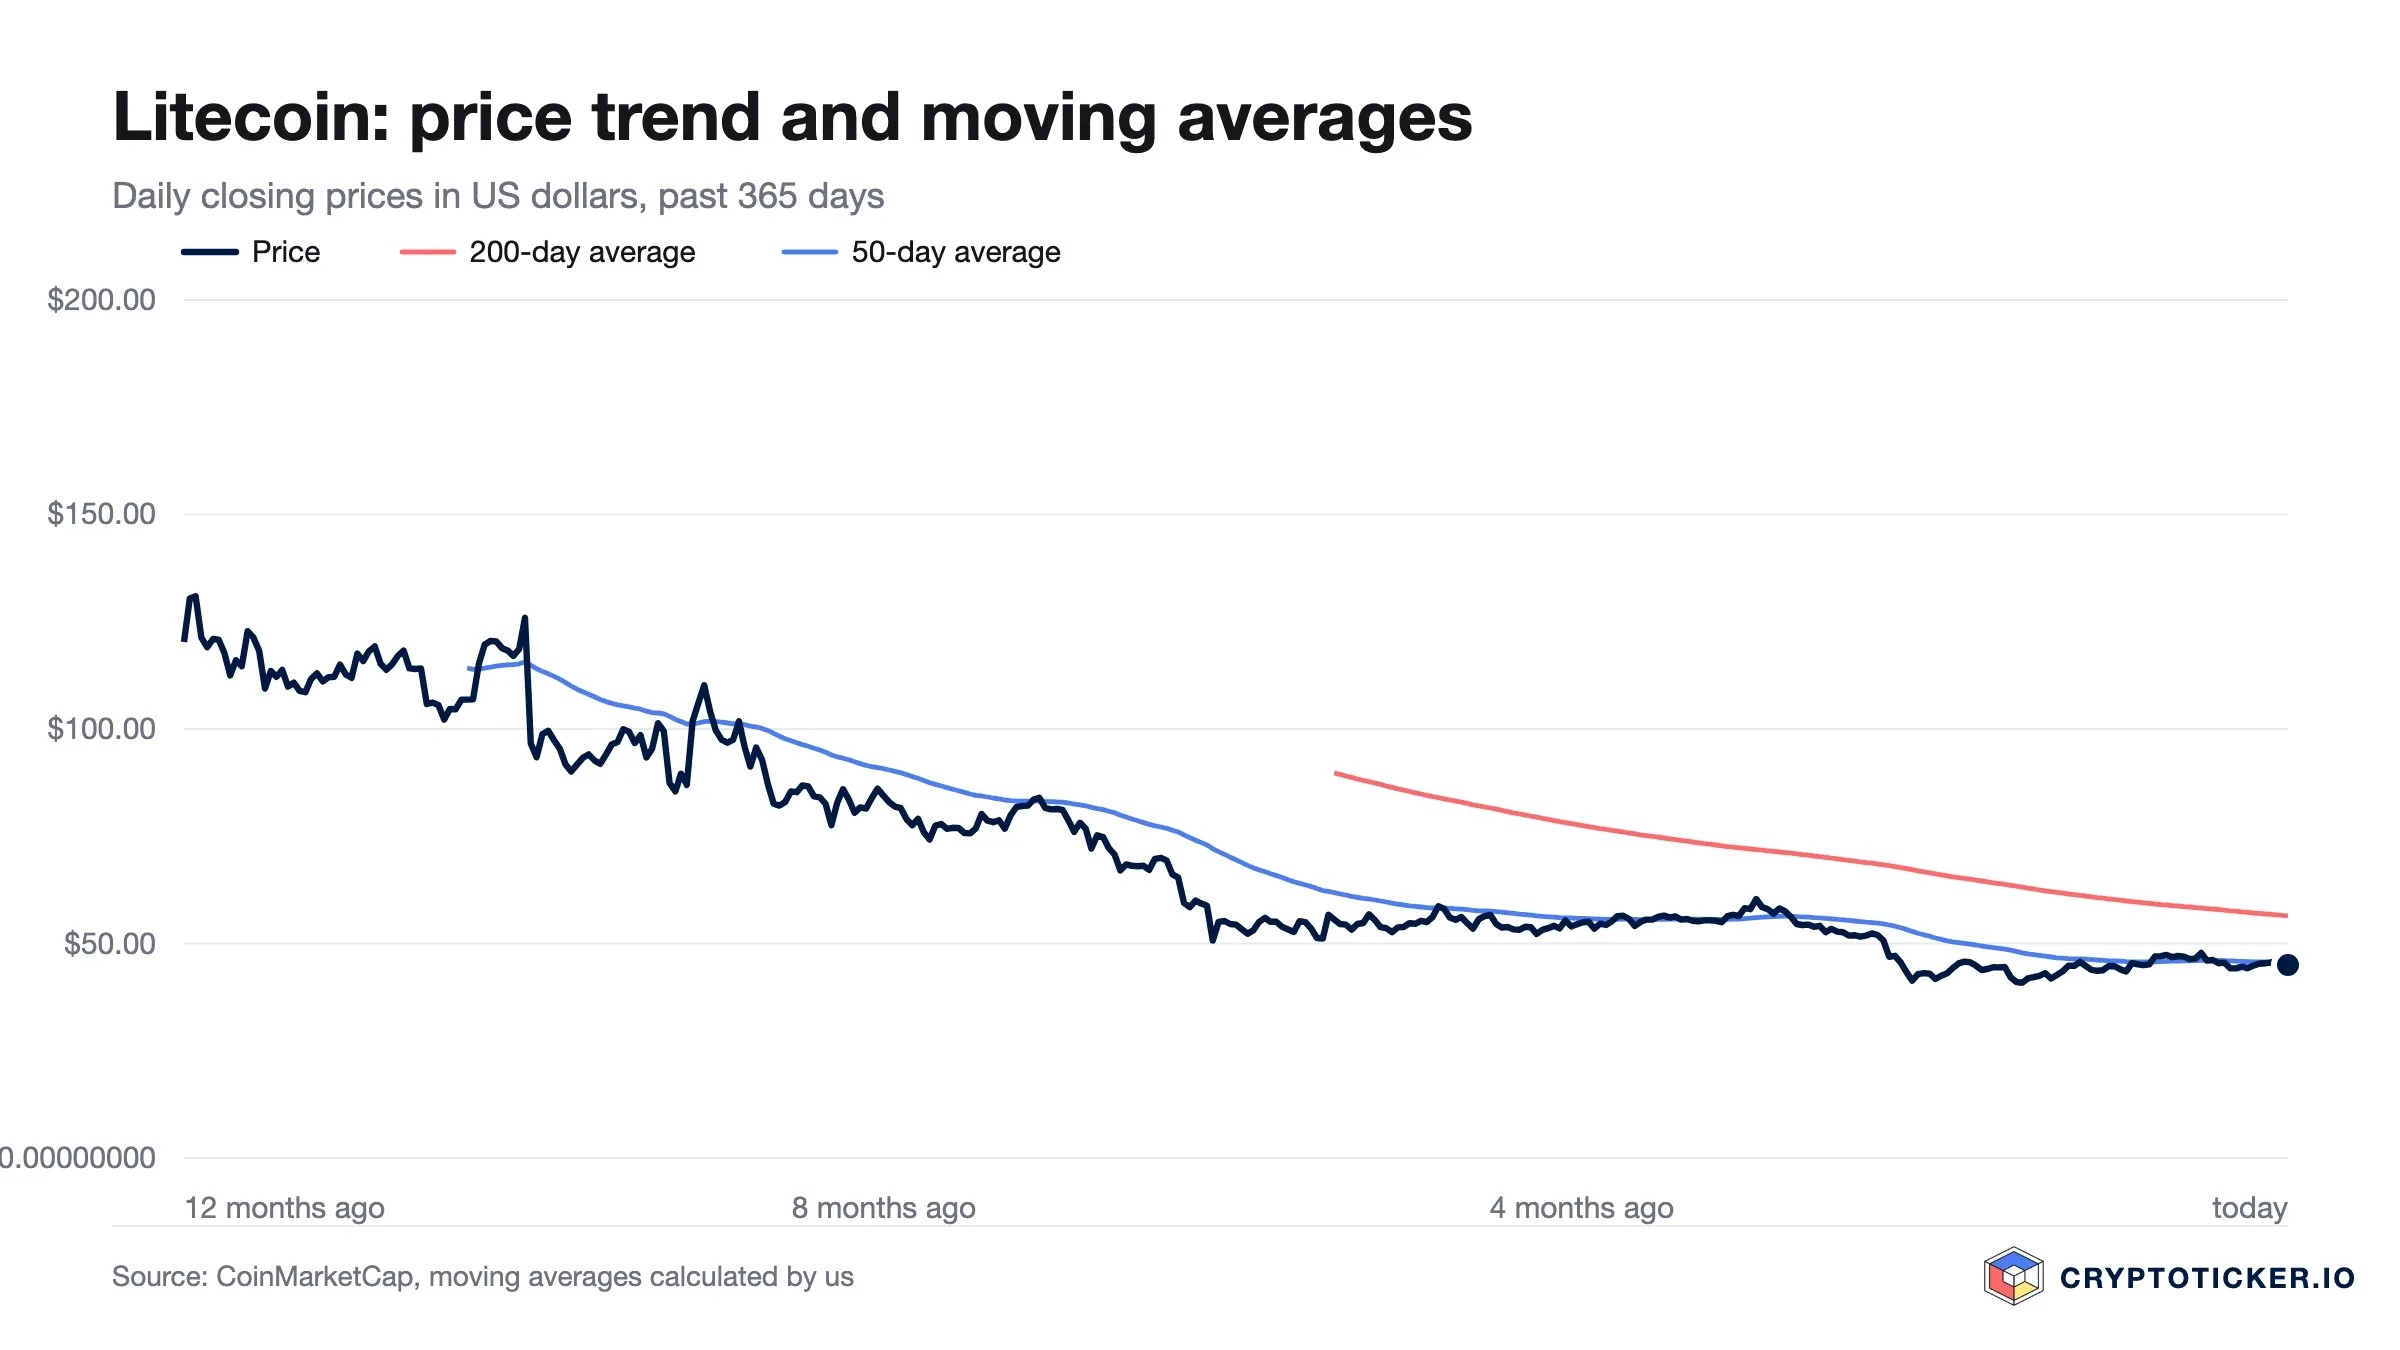
A downtrend counts as technically broken once the price sets a higher low and then clears a previous interim high. For Litecoin the first condition is partly met and the second is not. The price has gained since the low of 40.85 USD on 26 June 2026, yet a new local high is missing.
The pattern therefore points to an interruption rather than a break. After the decline from 130.97 USD in August 2025 to 40.85 USD in June 2026, what follows is a sideways phase at a low level. Such phases tend to form when sellers have largely worked through their positions and buyers see no reason to commit. The resolution remains open in both directions.
Two levels make the question testable. If the price falls below 40.85 USD and closes there for several days, the bottoming process is disproved and the downtrend confirmed. If it rises above the 200-day average of 56.45 USD and holds, the trend would be broken for the first time in a year. The price currently sits between those values.
What RSI and moving averages mean for a Litecoin entry
The 14-day relative strength index stands at 48.1, in the middle of its scale. Readings below 30 count as oversold and as a hint of a technical rebound, readings above 70 as overbought. For an entry that means no tailwind from an extreme reading, and no purchase into an overheated move either.
The position of the two averages relative to each other says more. The 50-day average at 45.68 USD lies well below the 200-day average at 56.45 USD. That reflects a weaker trajectory over recent months and is commonly read as an intact downtrend. It would resolve only once the 50-day value crosses the 200-day value from below. For that, the 50-day average would have to climb roughly 24 per cent, so the market is a long way from that point.
Two defensible readings follow from the same data. Investors working against the cycle see a price close to the yearly low and a neutral RSI as an opportunity to build a position gradually. Trend-following investors wait for the crossover and pay a higher entry price for that confirmation.
What trading volume reveals about Litecoin demand
Litecoin worth around 137 million USD changed hands over the past 24 hours. The 30-day average stands at about 202 million USD and the 90-day average at roughly 235 million USD. Current turnover is therefore close to a third below the monthly average.
Falling volume alongside a stable price cuts both ways. It shows that selling pressure has eased, because a sell-off requires turnover. It also shows that little fresh capital is arriving. A floor built on thin volume carries less far than one formed under high turnover, because fewer market participants have confirmed it.
The ratio of daily turnover to market capitalisation is around 3.9 per cent. That is enough to trade sizeable amounts without moving the price much, which keeps the cost of a later exit calculable. Sentiment supports the picture: the Fear and Greed Index stands at 37 points, inside the fear range. Buying opportunities have historically appeared more often during phases of fear, though the index says nothing about how long such a phase lasts.
Which structural factors speak for Litecoin
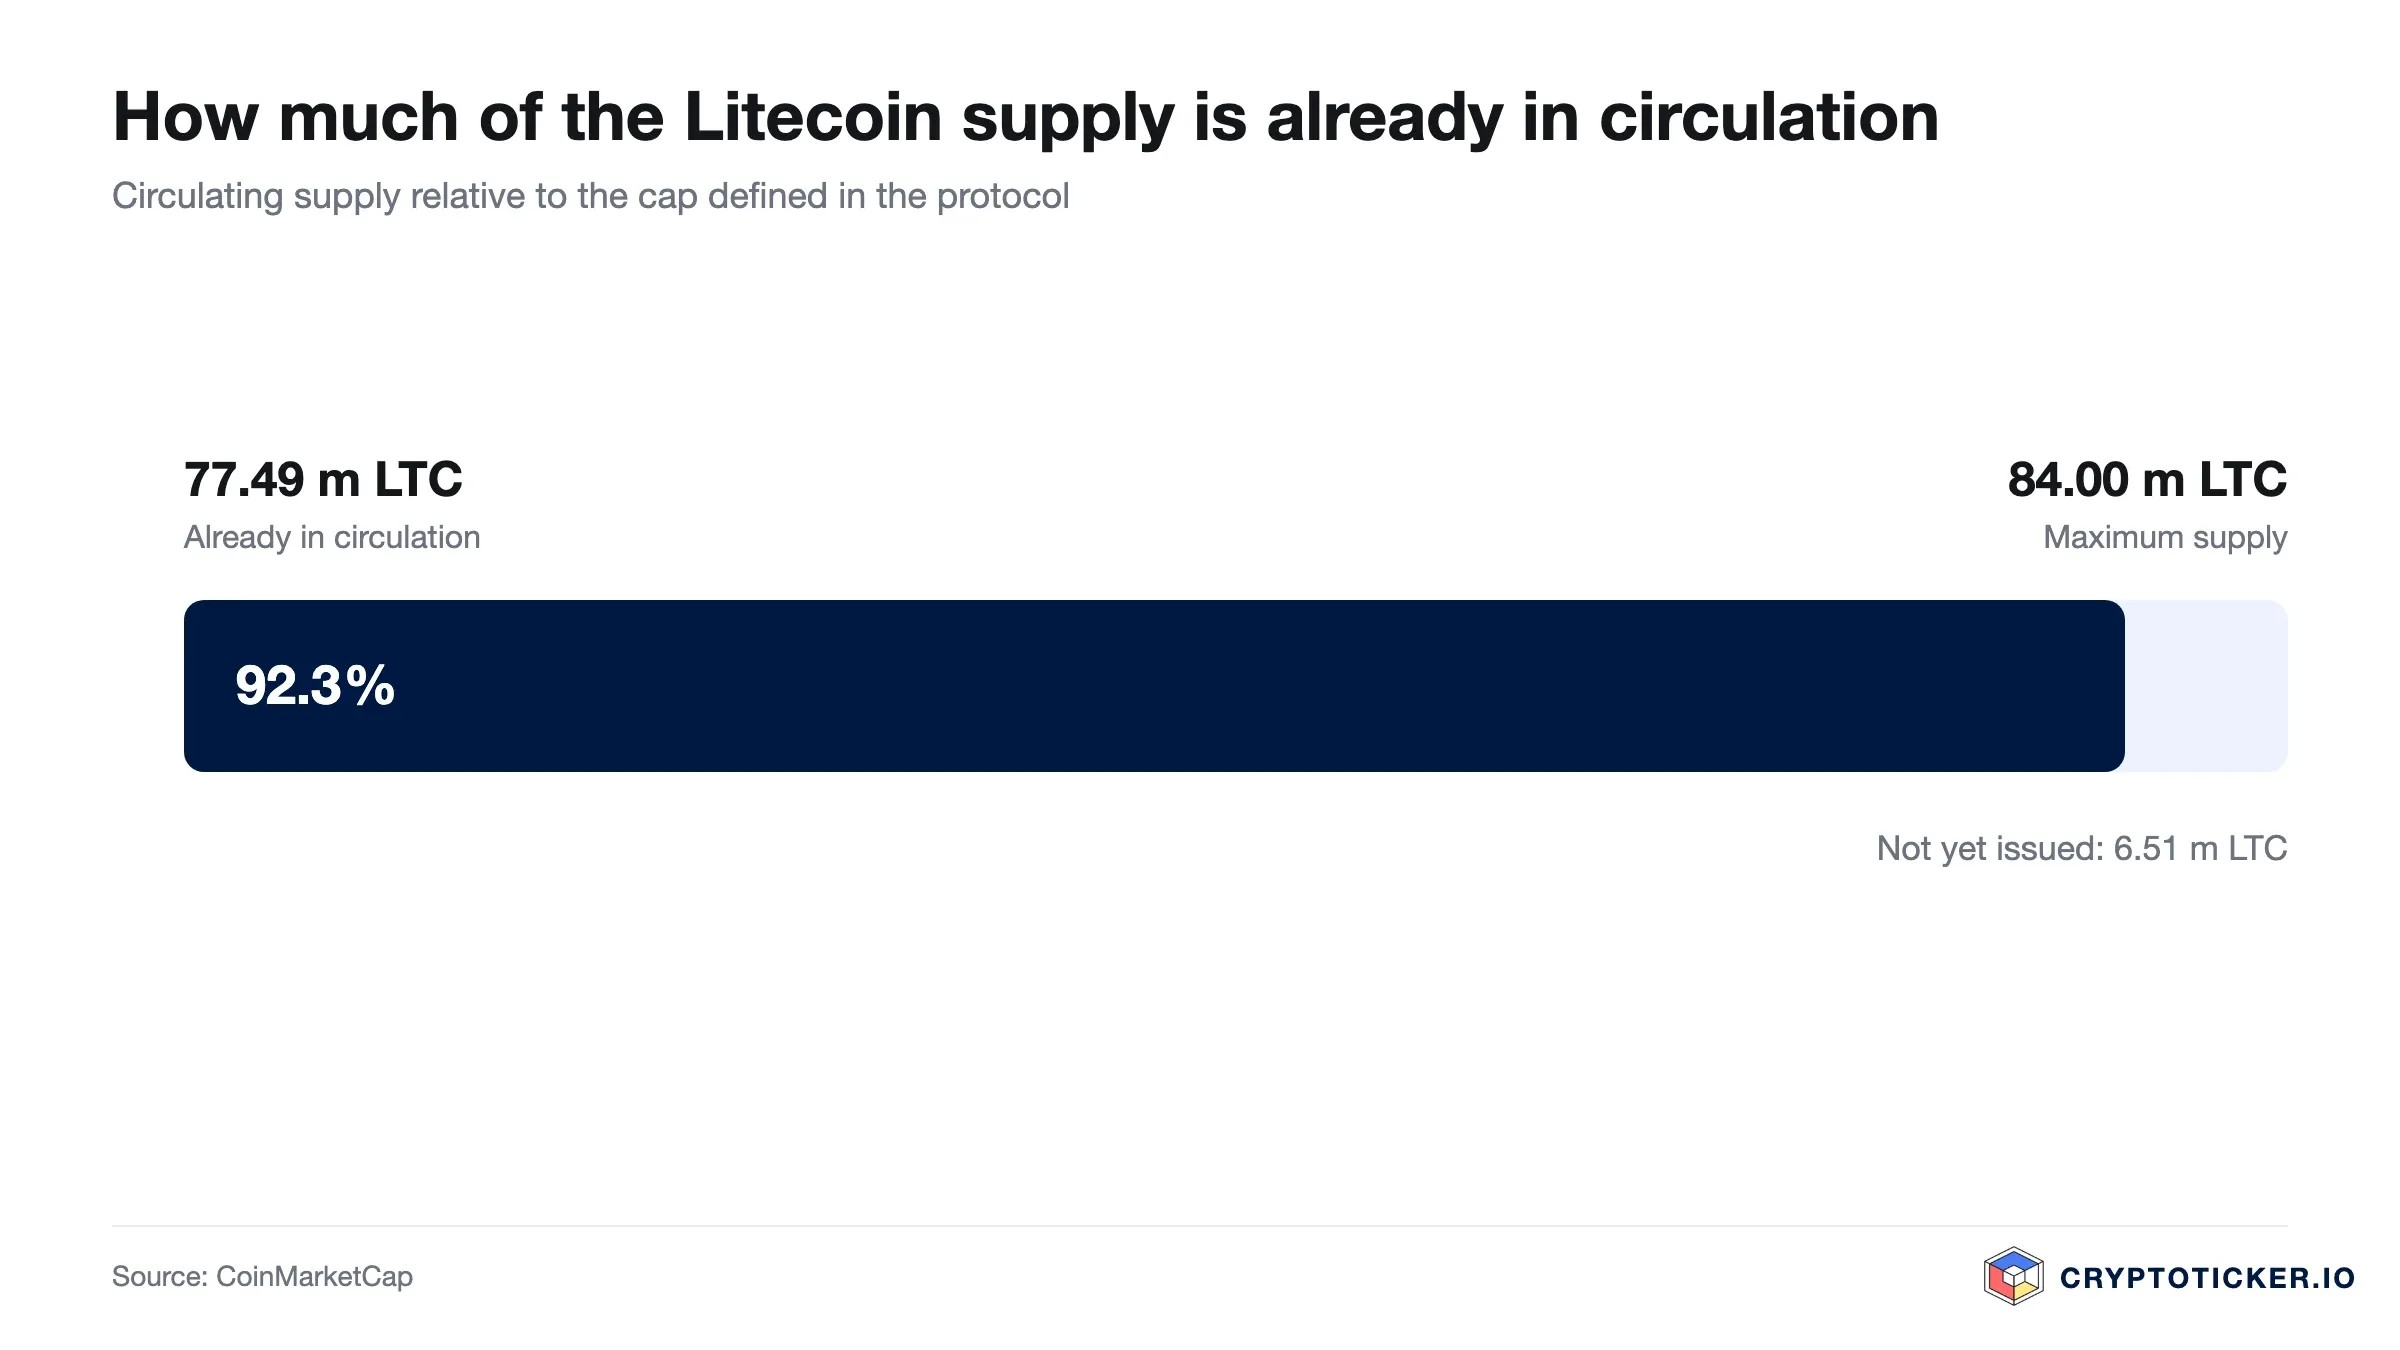
Supply mechanics are the most solid point. Litecoin is capped at 84 million units, with around 77.49 million in circulation. Just over 92 per cent of the supply has been issued, leaving roughly 6.51 million units for the decades ahead. The issuance rate halves about every four years; the last halving cut the block reward to 6.25 Litecoin in August 2023, and the next one is expected in 2027. Where no fixed ceiling exists, the number can be raised later; here it cannot.
Technically, Litecoin is an early variation on the design set out in the Bitcoin white paper. Block time is about 2.5 minutes rather than ten, which speeds up confirmations. The network has run since 2011 without an extended outage, a record few assets in this segment can show.
Regulation favours Litecoin partly because of its age. The asset existed long before most of today's rule books, and it has no issuing company and no foundation distributing proceeds. In the European Union the regulation on markets in crypto-assets has applied in full since the end of 2024, and its implementation is overseen by the European Securities and Markets Authority. Litecoin is listed at almost every regulated venue, as our comparison of regulated crypto exchanges shows.
What speaks for buying Litecoin at current prices
- The price sits close to the yearly low. At 45.27 USD you pay 65.4 per cent less than at the 12-month high of 130.97 USD. That materially reduces the amount at risk should the decline continue.
- Selling pressure has measurably eased. The past 30 days show a gain of 3.0 per cent and the June low of 40.85 USD has not been retested. That combination often appears at the end of distribution phases, though it guarantees no floor.
- The supply side is settled. Just over 92 per cent of the maximum supply has been issued and the next halving is due in 2027. Younger projects still face large unlocks from team and investor allocations; Litecoin does not.
What speaks against buying Litecoin at current prices
- The downtrend is technically intact. The price stands 19.8 per cent below the 200-day average of 56.45 USD, and the 50-day average of 45.68 USD would have to gain roughly 24 per cent to reach that line. Until the two cross, a purchase runs against the broader trend.
- Demand is thin. Daily volume is about a third below the monthly average of 202 million USD. A bottoming process without turnover holds up poorly against a renewed wave of selling.
- The competitive position has narrowed. Cheap and fast payments are now offered by networks with larger application ecosystems and by dollar-pegged crypto assets. The original advantage over Bitcoin counts for less than it did.
How to buy Litecoin at current prices
Litecoin trades at practically every major exchange. The cost comes in two parts. The stated trading fee at European venues ranges from about 0.1 to 1.5 per cent depending on the model, and on top of it comes the spread between buying and selling price, which is often wider than the fee itself where no open order book exists. At a price around 45 USD, one percentage point amounts to roughly 45 cents per unit. How the providers bill for this is set out in our comparison of the best crypto exchanges; our reports on Bitpanda and Kraken cover individual venues in detail.
Custody depends on the investment horizon. For short-term positions an exchange account is practical. Over longer holding periods the calculation shifts, because a balance held at an exchange belongs to you economically while sitting technically in someone else's custody. Your own wallet resolves that question and moves the responsibility to you, including safekeeping of the recovery phrase. Which devices are suitable is covered in our hardware wallet comparison.
Tax treatment differs by country, and in several European jurisdictions it depends on how long the position is held. Record purchase dates and acquisition costs from the outset, and clarify your own case with a tax adviser before it becomes relevant.
So is Litecoin a good buy at current prices?
Over the short term the counterarguments dominate. The price sits below both moving averages, the RSI of 48.1 gives no signal, and volume is falling. Investors betting on a quick move find no basis for it in this data. On a horizon of a few weeks, a continuation of the range between 40.85 USD and the zone around the 50-day average of 45.68 USD is the realistic case.
Over the long term the arithmetic looks different. A network that has run since 2011, whose supply is more than 92 per cent issued and whose issuance rate halves again in 2027, rests on a comprehensible foundation. A price of 45.27 USD, close to the 12-month low of 40.85 USD, already reflects part of the weak demand. Building a position in tranches spreads the risk of missing the floor across several points in time.
This assessment counts as disproved if the price posts several daily closes below 40.85 USD, because the bottoming process would then have failed. It would be confirmed if the price reclaims the 200-day average of 56.45 USD while volume rises above the monthly average of roughly 202 million USD. Both conditions can be checked against the same public data this article is calculated from. Which amount is defensible for you depends on your personal circumstances.
Buying Litecoin: what to take away
- Litecoin trades at 45.27 USD, 10.8 per cent above the 12-month low of 40.85 USD and 19.8 per cent below the 200-day average of 56.45 USD, while the 12-month high of 130.97 USD remains far away. The technical picture is open and the broader trend still points down. Longer-term scenarios are set out in the Litecoin price prediction.
- The supply side argues for the asset and the demand side against it: 92 per cent of the maximum supply is issued, while volume runs a third below the monthly average. Investors entering now should do so in tranches and pick a regulated venue from our comparison of regulated crypto exchanges.
- On costs, the sum of fee and spread decides the outcome; over longer holding periods, the custody question does. Both are settled before the purchase via the exchange comparison and the hardware wallet comparison.
Disclosure: Some of the providers mentioned in this article work with us through partner programmes. This has no influence on the price analysis or on our assessment of the chart situation; the price data comes from a public market data source and can be verified there.
(As of 12 August 2026. This article is not investment advice. Prices, fees and terms change; check them with the provider before every purchase. Crypto assets are subject to high price volatility and a total loss is possible.)
Transparency note: This article was produced with the assistance of artificial intelligence and reviewed by our editorial team before publication. All figures and claims were checked against the primary sources linked in the text. The feature image was generated with AI.