
 coinedition.com
TRON is showing renewed strength as rising stablecoin activity and improving spot flows support its latest price move. $TRX trades near $0.3356 after gaining 1.19% over the past 24 hours. The token has also climbed 2.77% over the past week. Meanwhile, TRON continues to handle enormous $USDT transfer volumes across its network.
Stablecoin Activity Strengthens TRON’s Case
TRON processed approximately $2.1 trillion in $USDT transfers, highlighting its growing role in stablecoin settlement. Additionally, $USDT supply on the network reached roughly $87.9 billion.
That scale gives TRON a stronger fundamental narrative beyond speculative DeFi activity. Stablecoins continue driving significant blockchain demand, particularly for payments and cross-border value transfers.
TRON also recorded around 11.8 million daily transactions and approximately 3.6 million active addresses. Network fees recovered 15.9% to nearly $700 million.
$TRX keeps looking more like a payments network than a DeFi chain.
— Senior 🛡🦇🔊 (@SeniorDeFi) August 11, 2026
$USDT supply on Tron reached $87.9B in Q2, while transfers hit $2.1T.
Daily transactions climbed to 11.8M, active addresses to 3.6M, and fees rebounded 15.9% to nearly $700M.
What stands out to me is the split… pic.twitter.com/wlY5FfG5pg
Significantly, these figures suggest that users continue generating meaningful economic activity across the network. Besides, TRON’s growing settlement role could support demand for $TRX over time.
However, DeFi activity presents a mixed picture. Total value locked has declined toward $4.4 billion, while decentralized exchange volumes have weakened.
$TRX Technical Structure Turns Bullish
$TRX currently trades above its major four-hour exponential moving averages. That positioning supports the token’s short-term bullish structure.
Price also moved above the 0.786 Fibonacci level at $0.3320. Hence, buyers now control an important technical area.
The immediate resistance sits at $0.3373, which also represents the 1.0 Fibonacci level. A sustained four-hour close above that level could strengthen the breakout.
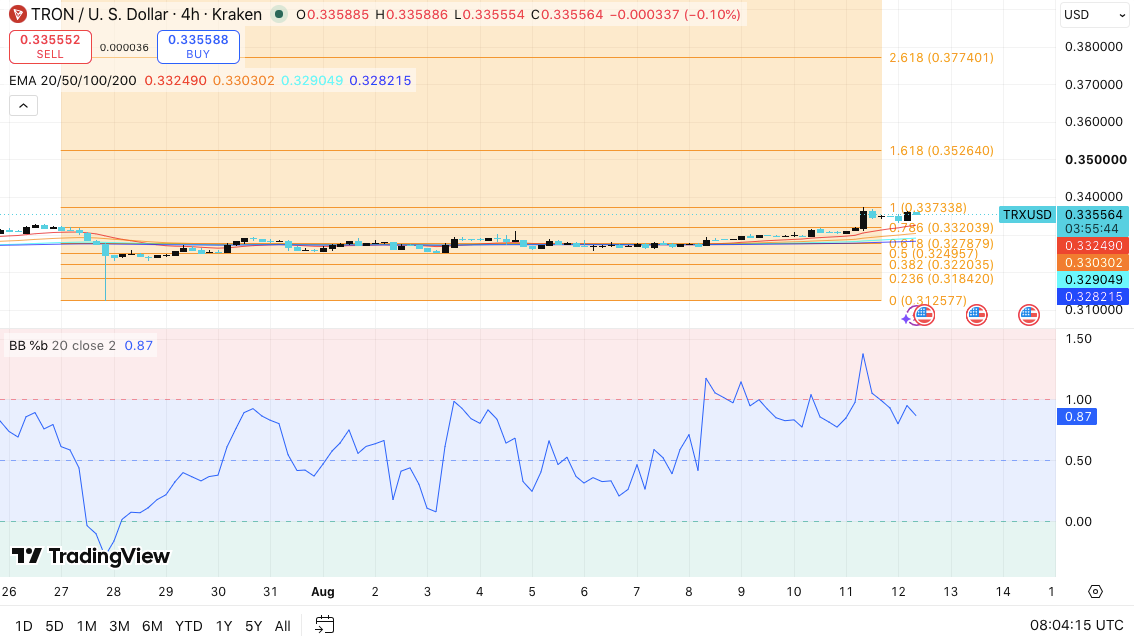
Consequently, bulls could target $0.3526, corresponding with the 1.618 Fibonacci extension. A stronger rally could then expose $0.3774 near the 2.618 extension.
However, momentum faces a potential near-term obstacle. The BB%B reading stands around 0.87, showing that $TRX trades close to the upper Bollinger Band.Therefore, traders could see short-term consolidation before another attempt higher.
Related: Ethereum Price Prediction: Is ETH’s Triangle Breakout to $2,150 Coming or Is the ETF Reversal a Warning Sign?
On the downside, $0.3320 to $0.3295 forms the first important support zone. A break below $0.3295 could shift attention toward $0.3260. Further weakness could expose $0.3202 and then $0.3139.
Open Interest Signals Cautious Positioning
TRON’s derivatives market tells a more cautious story than its spot chart. Open interest reached approximately $640 million near the end of July.
Since then, OI has fallen steadily toward $250.93 million as of August 12. The decline suggests traders have reduced leveraged exposure during the recent consolidation.
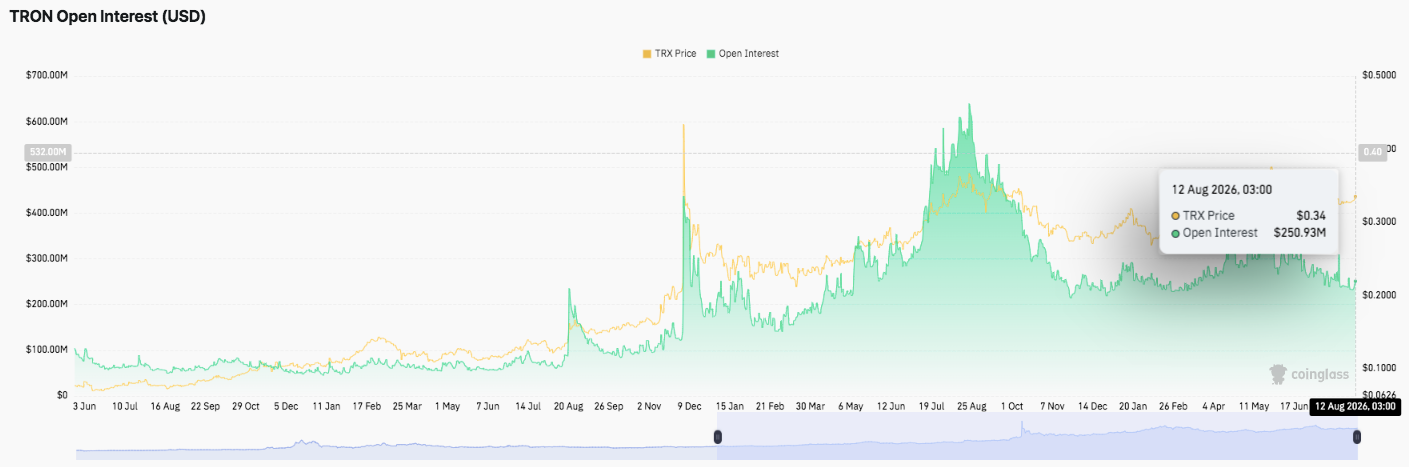
Additionally, OI remained between roughly $230 million and $280 million for much of the recent period. That range suggests derivatives participation remains active but considerably lower.
Related: Cardano Price Prediction: ADA Retreats From $0.20 as Analyst Warns of a Slide to $0.170
A recovery above $300 million could provide stronger confirmation for the next bullish move. Conversely, a drop below $230 million could signal renewed deleveraging. Hence, traders may need both price and derivatives participation to confirm a sustained breakout.
$TRX Flows Offer Another Bullish Signal
Spot market flows have gradually improved despite periods of heavy volatility. Earlier readings showed several sharp outflow spikes near $40 million and almost $50 million.
Those movements pointed to substantial selling pressure or exchange withdrawals during earlier phases. However, inflows have appeared more consistently since April.
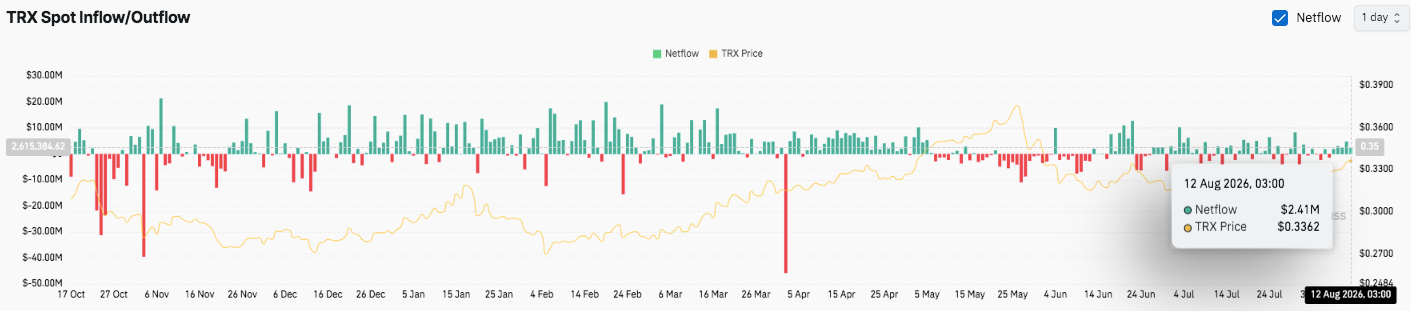
Recent positive readings generally ranged between $5 million and $20 million. The latest netflow reached approximately $2.41 million, indicating modest net buying pressure.
Moreover, the improving balance suggests selling intensity may have eased. That trend could complement $TRX’s technical recovery if inflows continue strengthening.
Technical Outlook for TRON Price
Key levels remain clearly defined for $TRX:
Upside levels: $0.3373 is the immediate hurdle, followed by $0.3526 and $0.3774. A decisive breakout above $0.3373 could strengthen bullish momentum and push $TRX toward the higher Fibonacci extensions.
Downside levels: $0.3320–$0.3295 forms the first support zone, followed by $0.3260, $0.3202, and $0.3139.
Resistance ceiling: $0.3373 remains the key level to flip for sustained bullish momentum. The technical structure favors buyers as $TRX trades above its major EMAs, although the elevated BB%B reading suggests possible short-term consolidation.
Will TRON Go Up?
$TRX’s near-term direction depends on whether buyers can defend $0.3295 and reclaim $0.3373 decisively. Stronger spot inflows and rising open interest could reinforce the bullish case.
Related: Velvet Price Prediction: VELVET Price Eyes $0.716 as Open Interest Falls From June Peak
A breakout could open the path toward $0.3526 and $0.3774, while losing $0.3295 could expose $0.3260 and lower. For now, $TRX remains at a critical technical juncture, with network activity providing an additional bullish catalyst.