
 invezz.com

$TRX price has gained about 2.5% over the past week as TRON’s stablecoin market cap reached a record $89.2 billion and quarterly $USDT transfers totaled $2.1 trillion.
Messari’s Q2 2026 State of TRON report, released on August 10, showed that stablecoin activity remained one of the network’s strongest areas during the quarter, with $USDT accounting for nearly all of the stablecoins circulating on TRON.
$TRX traded around $0.335 on August 12 after climbing from roughly $0.327 at the start of the seven-day period.
The token initially moved gradually through $0.330 before the advance accelerated late on August 11, taking the price briefly above $0.336.
The latest move has left $TRX up about 0.9% over the past 24 hours and 2.5% over seven days.
Price has also held most of the gains following the push above $0.33, rather than immediately returning to the range seen earlier in August.
Network data released this week has put TRON’s stablecoin business back into focus at the same time.
According to Messari, TRON processed $2.1 trillion in $USDT transfers during the second quarter of 2026.
The network’s total stablecoin market cap increased 4.1% from the previous quarter to an all-time high of $89.2 billion.
$USDT made up about $87.9 billion of that total at the end of Q2, giving Tether’s stablecoin a 98.5% share of stablecoins on TRON.
The transfer figures are relevant to $TRX because transactions on TRON consume bandwidth and energy, two network resources tied directly to the native token.
Users can spend $TRX for transactions or freeze and stake the token to obtain network resources, connecting network usage with demand for $TRX.
Messari’s report was not positive across every part of the network.
TRON’s DeFi total value locked fell 1.9% during Q2, while decentralized exchange volume dropped 21.7%, leaving stablecoin settlement as the stronger part of the network’s quarterly activity.
TRON price analysis
$TRX’s daily technical structure has improved after the latest move pushed the token above its major exponential moving averages.
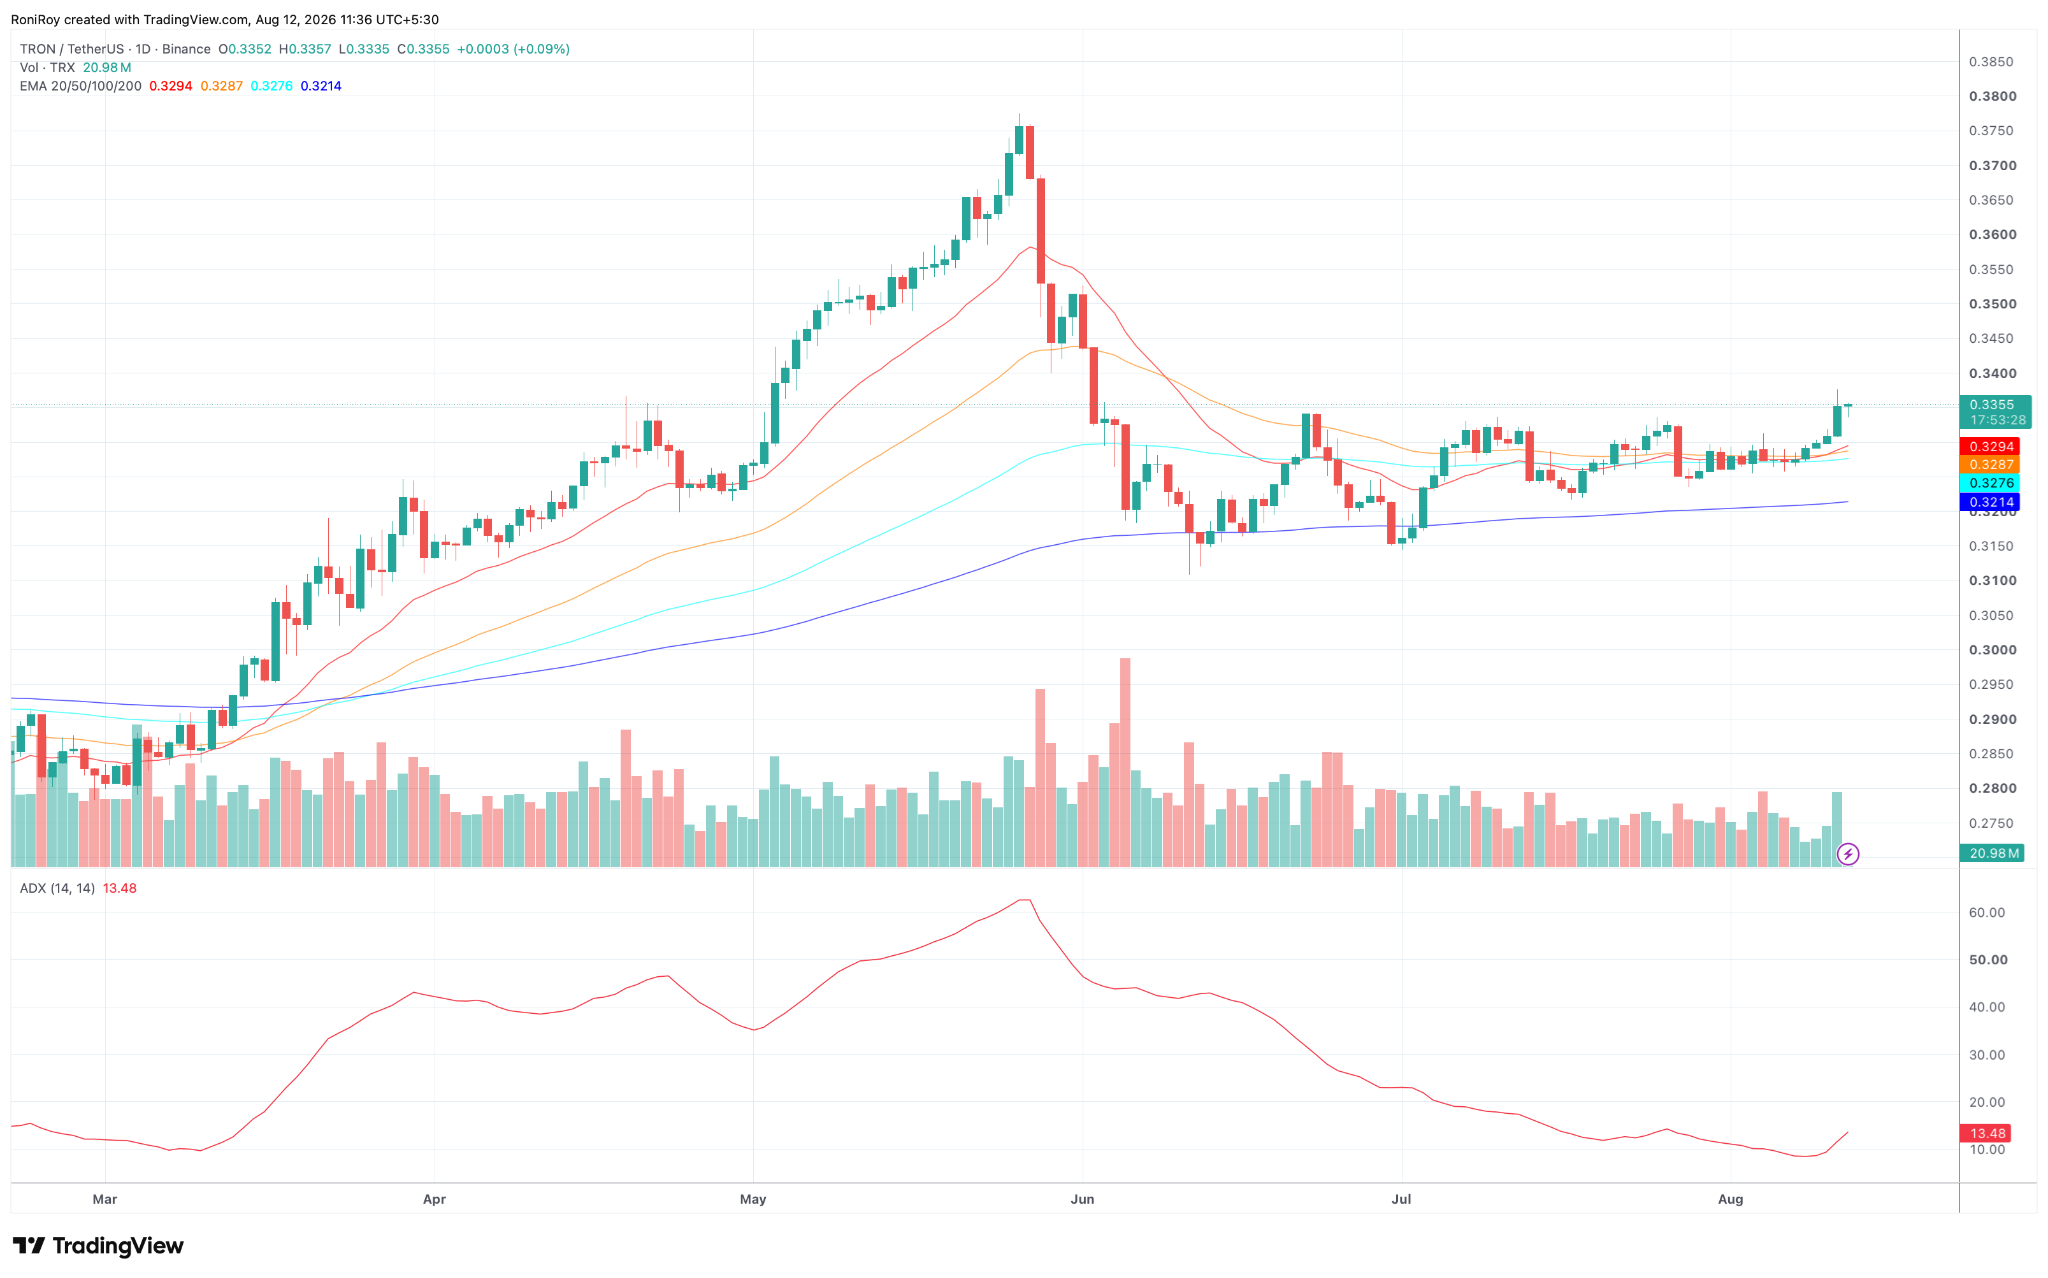
On the daily chart, the 20-day EMA is at roughly $0.3294, the 50-day EMA at $0.3287, the 100-day EMA at $0.3276 and the 200-day EMA at $0.3214.
$TRX/$USDT 1-day price chart. Source: TradingView.
With $TRX trading near $0.3355, the token sits above all four averages, while the 20-day EMA has moved back above the 50-day and 100-day averages.
The arrangement gives $TRX a supportive short-term structure, but the Average Directional Index has yet to confirm a strong trend.
The daily ADX stood at just 13.48, well below the 20–25 area commonly watched for evidence that a directional move is gaining strength.
However, ADX has started to turn higher after falling through much of July and early August.
A continued increase alongside a price hold above $0.335 would give the current breakout more technical support, while another decline in ADX could leave $TRX vulnerable to returning to its recent range.
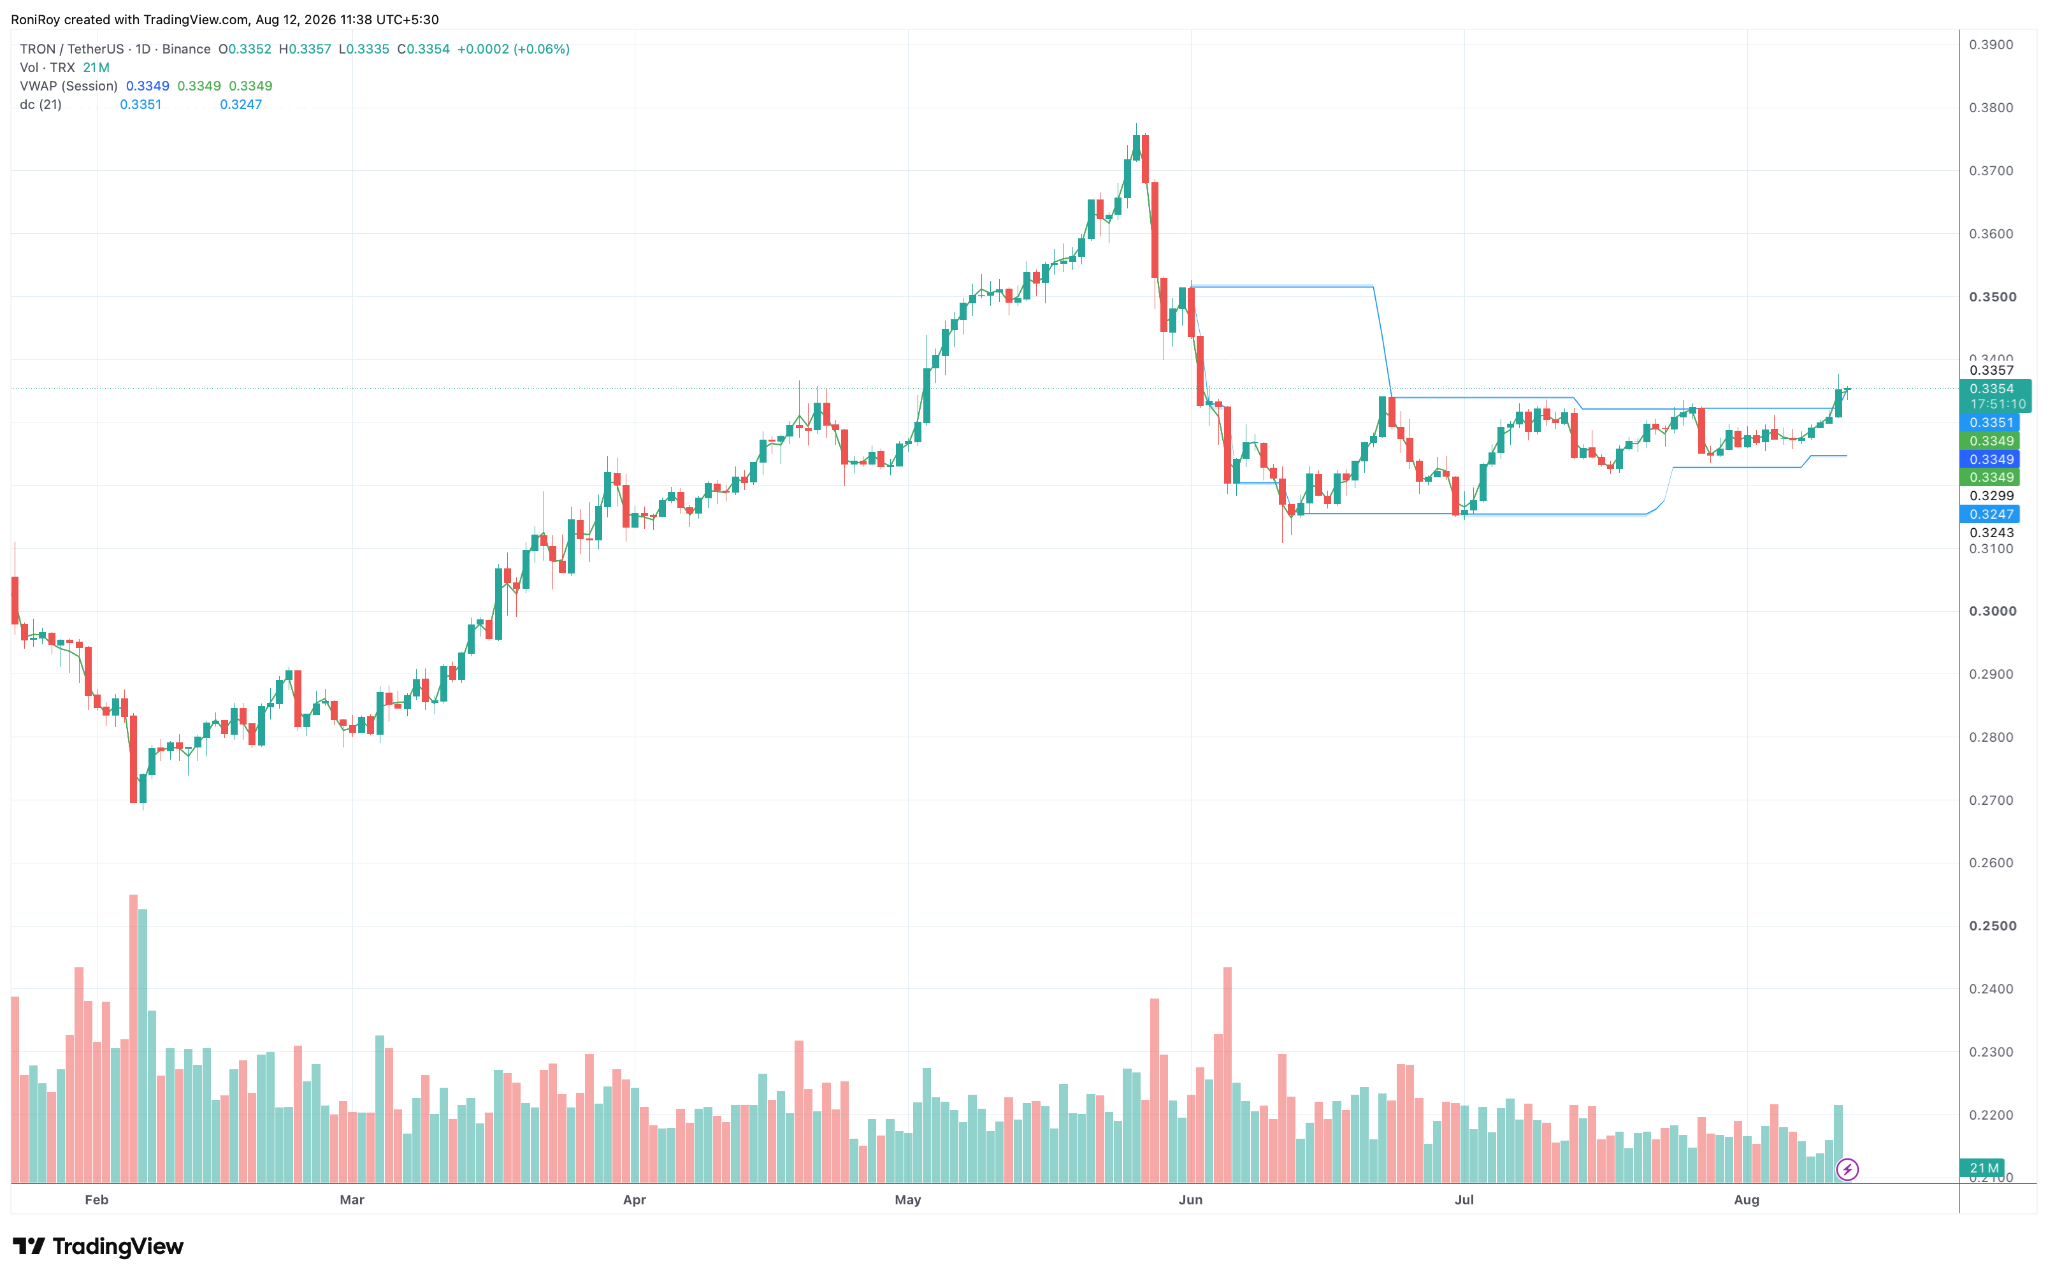
$TRX is also testing the upper boundary of its 21-day Donchian Channel with the upper band around $0.3351 and the lower band near $0.3247, with the token trading slightly above the upper boundary on August 12.
$TRX/$USDT 1-day price chart. Source: TradingView.
A daily close above the Donchian resistance would confirm a break above the recent trading range.
The first area to watch would then sit around $0.340, followed by the $0.350 region that acted as support and resistance during the sharp May-to-June correction.
If buying pressure carries $TRX through $0.350, the May peak around $0.375 would become the next major technical level. Reaching it from $0.335 would require an advance of roughly 12%.
The session VWAP was near $0.3349 on August 12, placing $TRX only slightly above the average price paid during the session.
Holding above that level would keep buyers in control of the latest move, while a drop back below it could put the breakout under pressure.
On the downside, the EMA cluster between roughly $0.3276 and $0.3294 forms the first major support zone.
A loss of that area would expose the Donchian lower band near $0.3247, followed by the 200-day EMA around $0.3214.