
 coinedition.com
The Solana price prediction just picked up its strongest ETF signal in three months, with spot funds pulling in $8.8 million on August 11, the biggest single-day inflow since May 12. $SOL trades at $75.87, barely moved on the day, but pressing against the top of an ascending triangle that’s been tightening since June for a second straight session.
Solana Price Prediction Today: $SOL Holds $75.87 at the Apex of an Ascending Triangle
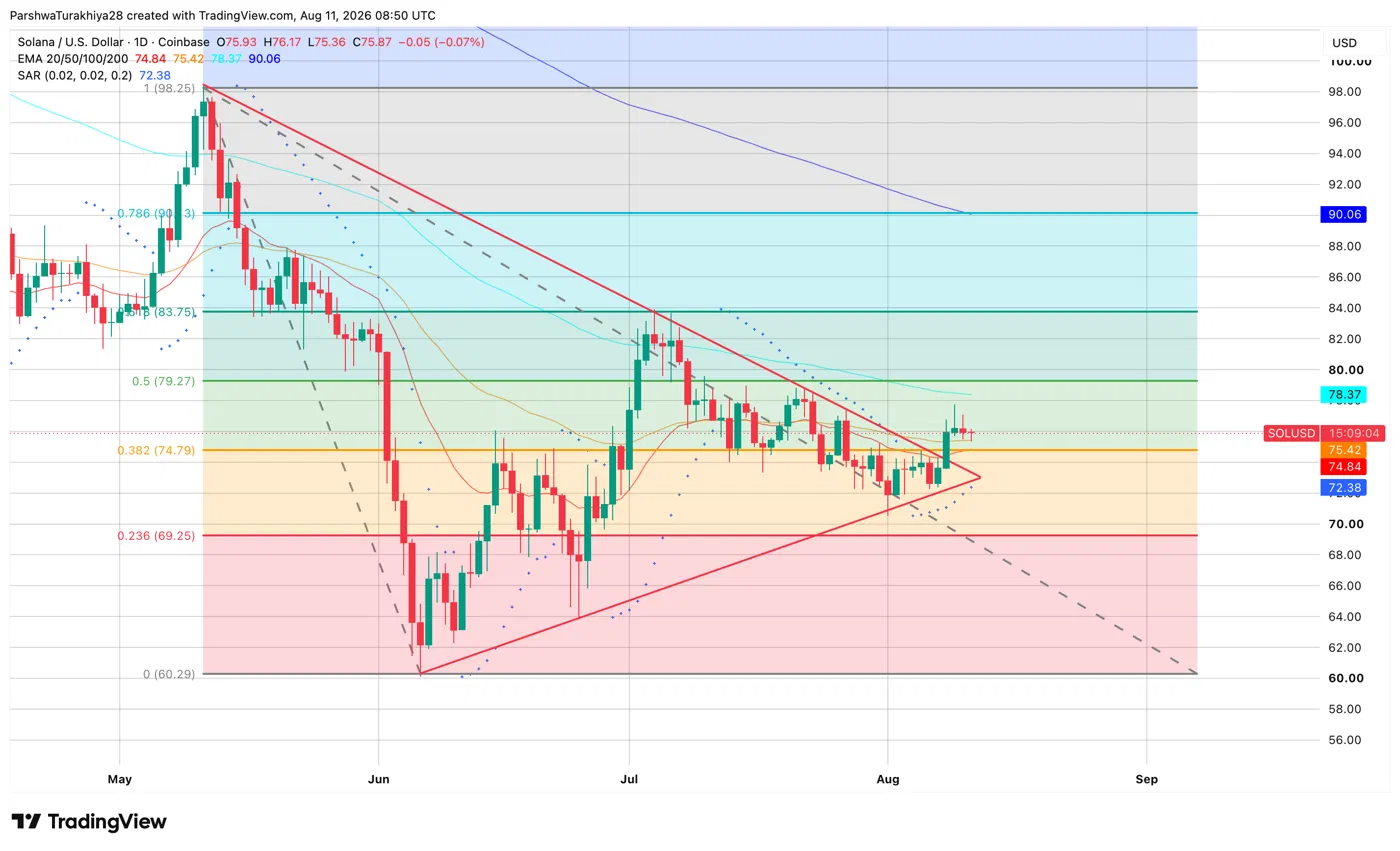
The daily chart shows $SOL sitting between the 0.382 Fibonacci at $74.79 and the 0.5 level at $79.27, inside an ascending triangle that has been tightening since the June low near $60.29. The lower trendline has been rising through each successive low, while the upper trendline near $76 to $78 has capped every recovery attempt. Today’s session opened at $75.93, pushed to $76.17, and is holding at $75.87, pressing directly against the upper trendline for the second consecutive session.
All four EMAs sit nearby. The 20-day at $74.84 and 50-day at $75.42 are just below as the first support cluster, with the 100-day at $78.37 sitting just above as the next resistance after the trendline. The 200-day at $90.06 and the 0.786 Fibonacci at $90.03 form the longer-term ceiling. The Parabolic SAR at $72.38 remains bullish below price. Analyst Ali Charts flagged the mid-range near $78.70 as the setup resistance trendline on the daily Tom DeMark signal, making the $78 to $79 zone the key confirmation level for any breakout move toward $100.
$SOL Support and Resistance Levels, August 11, 2026
| Type | Price | Level |
| Resistance | $78.37 | 100-day EMA |
| Resistance | $79.27 | 0.5 Fibonacci |
| Resistance | $83.75 | 0.618 Fibonacci |
| Resistance | $90.03 | 0.786 Fibonacci and 200-day EMA |
| Resistance | $100 | Ali Charts channel target |
| Support | $75.42 | 50-day EMA |
| Support | $74.84 | 20-day EMA |
| Support | $74.79 | 0.382 Fibonacci |
| Support | $72.38 | Parabolic SAR, bullish below price |
| Support | $69.25 | 0.236 Fibonacci |
Solana News: ETF Inflows Hit Three-Month High as On-Chain Milestones Stack Up
📈 Solana just saw $8.8M in daily net ETF inflows. That’s the strongest amount of money moving into ETF’s since May 12th, after several quiet sessions with little movement the past 3 months.
— Santiment Intelligence (@SantimentData) August 11, 2026
🏦 Solana’s RWA value, stablecoin supply, tokenized equity volume, and perps activity… pic.twitter.com/ZwN9pbJAeb
Santiment flagged on August 11 that Solana spot ETFs logged $8.8M in daily net inflows, the strongest single session since May 12 after several quiet months with minimal movement. The return of ETF flow arrives as Solana’s fundamental metrics have been quietly hitting milestones in the background. RWA value, stablecoin supply, tokenized equity volume, and perpetuals activity have all reached major levels over the past two months, keeping the network active while $SOL’s price remained dormant.
On the infrastructure side, Alpenglow is targeting roughly 150ms finality, Agave 4.2 is approaching August mainnet adoption, and xStocks has expanded tokenized equity access across Solana-linked rails.
Solana is 65% of all onchain activity in crypto but only 2.38% of all market capitalization pic.twitter.com/3rTqqfYorG
— vibhu (@vibhu) August 10, 2026
Analyst Vibhu added the sharpest framing: Solana is processing roughly 65% of all on-chain activity in crypto while representing just 2.38% of total market capitalization. That gap between network usage and market value is either a mispricing or a ceiling waiting to be tested.
$SOL Analysis: What the Tom DeMark Buy Signal and MACD Golden Cross Mean for $100?
SOLANA BREAKOUT. TARGET $100.
— Ali Charts (@alicharts) August 9, 2026
1/5 🧵👇
Analyst Ali Charts published a five-part thread on August 9 laying out the case for a $SOL breakout to $100, with three signals arriving at the same time.
A Tom DeMark Sequential buy signal has printed on the daily chart, which typically signals a one to four candle upswing or the start of a new bullish trend. The MACD has also printed a golden cross, adding momentum confirmation on top of the DeMark signal. And $SOL is trading inside a parallel channel where breaking above the mid-range opens the path toward the channel’s upper boundary near $100.
The level that ties all three together is $78.70. That is where Ali Charts placed the setup’s resistance trendline, and it sits almost exactly on the 100-day EMA at $78.37 and the 0.5 Fibonacci at $79.27. A daily close above that $78 to $79 zone would confirm all three signals simultaneously and set the trajectory toward $100.
$SOL Derivatives: Longs Absorbing Pain as Volume and Options Activity Fall
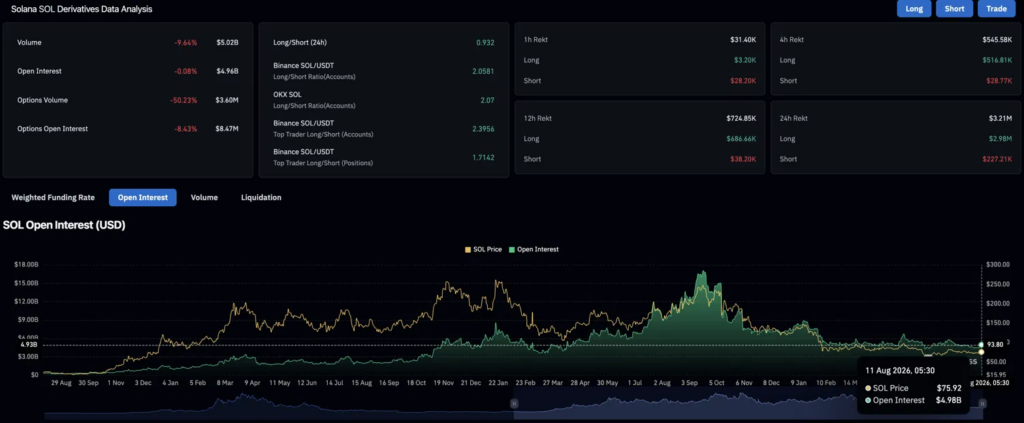
Volume fell 9.64% to $5.02B and open interest was nearly flat at $4.96B, pointing to a quiet session where traders held positions rather than adding new ones. Despite the overall long/short ratio sitting slightly short at 0.932, Binance retail at 2.0581, OKX at 2.07, and top trader accounts at 2.3956 all lean long, meaning the aggregate number is being pulled down by position sizing rather than genuine bearish conviction.
Liquidations over 24 hours totaled $3.21M, with longs absorbing $2.98M of that against just $227.21K for shorts, showing that buyers are currently taking the pain while the triangle decision plays out.
| Metric | Value | Interpretation |
| 24h Volume | $5.02B (-9.64%) | Quieter session, less directional trading |
| Open Interest | $4.96B (-0.08%) | Broadly unchanged |
| Long/Short Ratio (24h) | 0.932 | Slightly net short overall |
| Top Trader L/S (Positions) | 1.7142 | Large accounts net long |
| 24h Liquidations | $3.21M | Longs absorbed nearly all the pain |
$SOL Price Prediction: Upside and Downside Targets
Bullish Case, Target: $100 (Channel Upper Boundary)
$SOL breaks above the ascending triangle upper trendline and clears the $78.70 Tom DeMark resistance level on a daily close. The return of ETF inflows after three months of silence attracts fresh institutional capital, and the MACD golden cross sustains momentum through the 100-day EMA at $78.37 and the 0.5 Fibonacci at $79.27. Price extends toward the 0.618 Fibonacci at $83.75 and then the 200-day EMA at $90 before reaching Ali Charts’ $100 channel target.
Bearish Case, Risk Level: $69.25 (0.236 Fibonacci)
The ascending triangle upper trendline rejects price for the third consecutive session and $SOL loses the 20-day EMA at $74.84 on a daily close. The ETF inflow proves to be a one-day event rather than a trend reversal and the Tom DeMark and MACD signals fail to follow through. Price retreats toward the Parabolic SAR at $72.38 and, if that breaks, the 0.236 Fibonacci at $69.25 as the next meaningful support above the June low at $60.29.
Conclusion
$SOL’s setup right now is unusually well layered for a chart that’s barely moved in price: a technical pattern nearing its decision point, a rare confluence of Tom DeMark and MACD signals, and the first real ETF inflow in three months, all landing in the same week.
None of it means much until the chart confirms it, though. $78.70 is the number that turns this from a promising setup into an actual breakout, and until $SOL closes above it, the triangle could just as easily reject a third time and send price back toward $69.25.
FAQs: Solana ($SOL) Price Prediction
$SOL trades at $75.87 and is pressing the top of an ascending triangle. The bullish target is $100; the bearish risk level is $69.25 (0.236 Fibonacci) if the triangle rejects again.
Spot ETFs logged $8.8M in net inflows, the strongest single day since May 12, according to Santiment. It follows several quiet months and arrives alongside rising RWA value, stablecoin supply, and tokenized equity activity on Solana.
It’s a technical indicator that flags exhaustion in a prior trend and typically anticipates a short upswing or the start of a new bullish move. Analyst Ali Charts flagged it on $SOL’s daily chart alongside a MACD golden cross, both pointing toward a possible breakout to $100.
$78.70, where the Tom DeMark resistance trendline lines up with the 100-day EMA at $78.37 and the 0.5 Fibonacci at $79.27. A daily close above that zone is the confirmation Ali Charts is watching for.
Analyst Vibhu has flagged that Solana processes roughly 65% of all on-chain crypto activity while representing just 2.38% of total market capitalization, a gap some analysts read as undervaluation rather than fair pricing.
$SOL has real bullish signals stacking up, including ETF inflows and a Tom DeMark buy signal, but the triangle hasn’t broken yet after multiple rejections. Weigh the bullish and bearish cases above against your own risk tolerance.