
 u.today

Although Shiba Inu's futures net flow increased spectacularly by 3,402% for a brief period of time, the four-digit percentage is much less dramatic than it first seems. Rather than thousands of percent more capital abruptly entering $SHIB derivatives, the move reflects how the metric is calculated.
It's not a big deal
Net flow is the sum of future inflows and outflows. The net value that results can be very small when those two numbers are almost equal. Because it is measured against that small prior base, a subsequent increase of even a few hundred thousand dollars can result in a huge percentage change.
Over the course of an hour, $SHIB futures saw inflows of roughly $662,280 and outflows of $393,610, resulting in a positive net flow of roughly $268,670. That net inflow only amounts to about 0.010% of $SHIB's market capitalization, despite the significant percentage swings associated with the metric.
Longer time frames further clarify the situation. While the 12-hour reading was actually negative by $1.44 million because $7.25 million in outflows exceeded $5.81 million in inflows, the eight-hour futures net flow was positive by about $142,120. Additionally, spot activity does not show much evidence of a massive capital rotation.
Shiba Inu's capital rotation
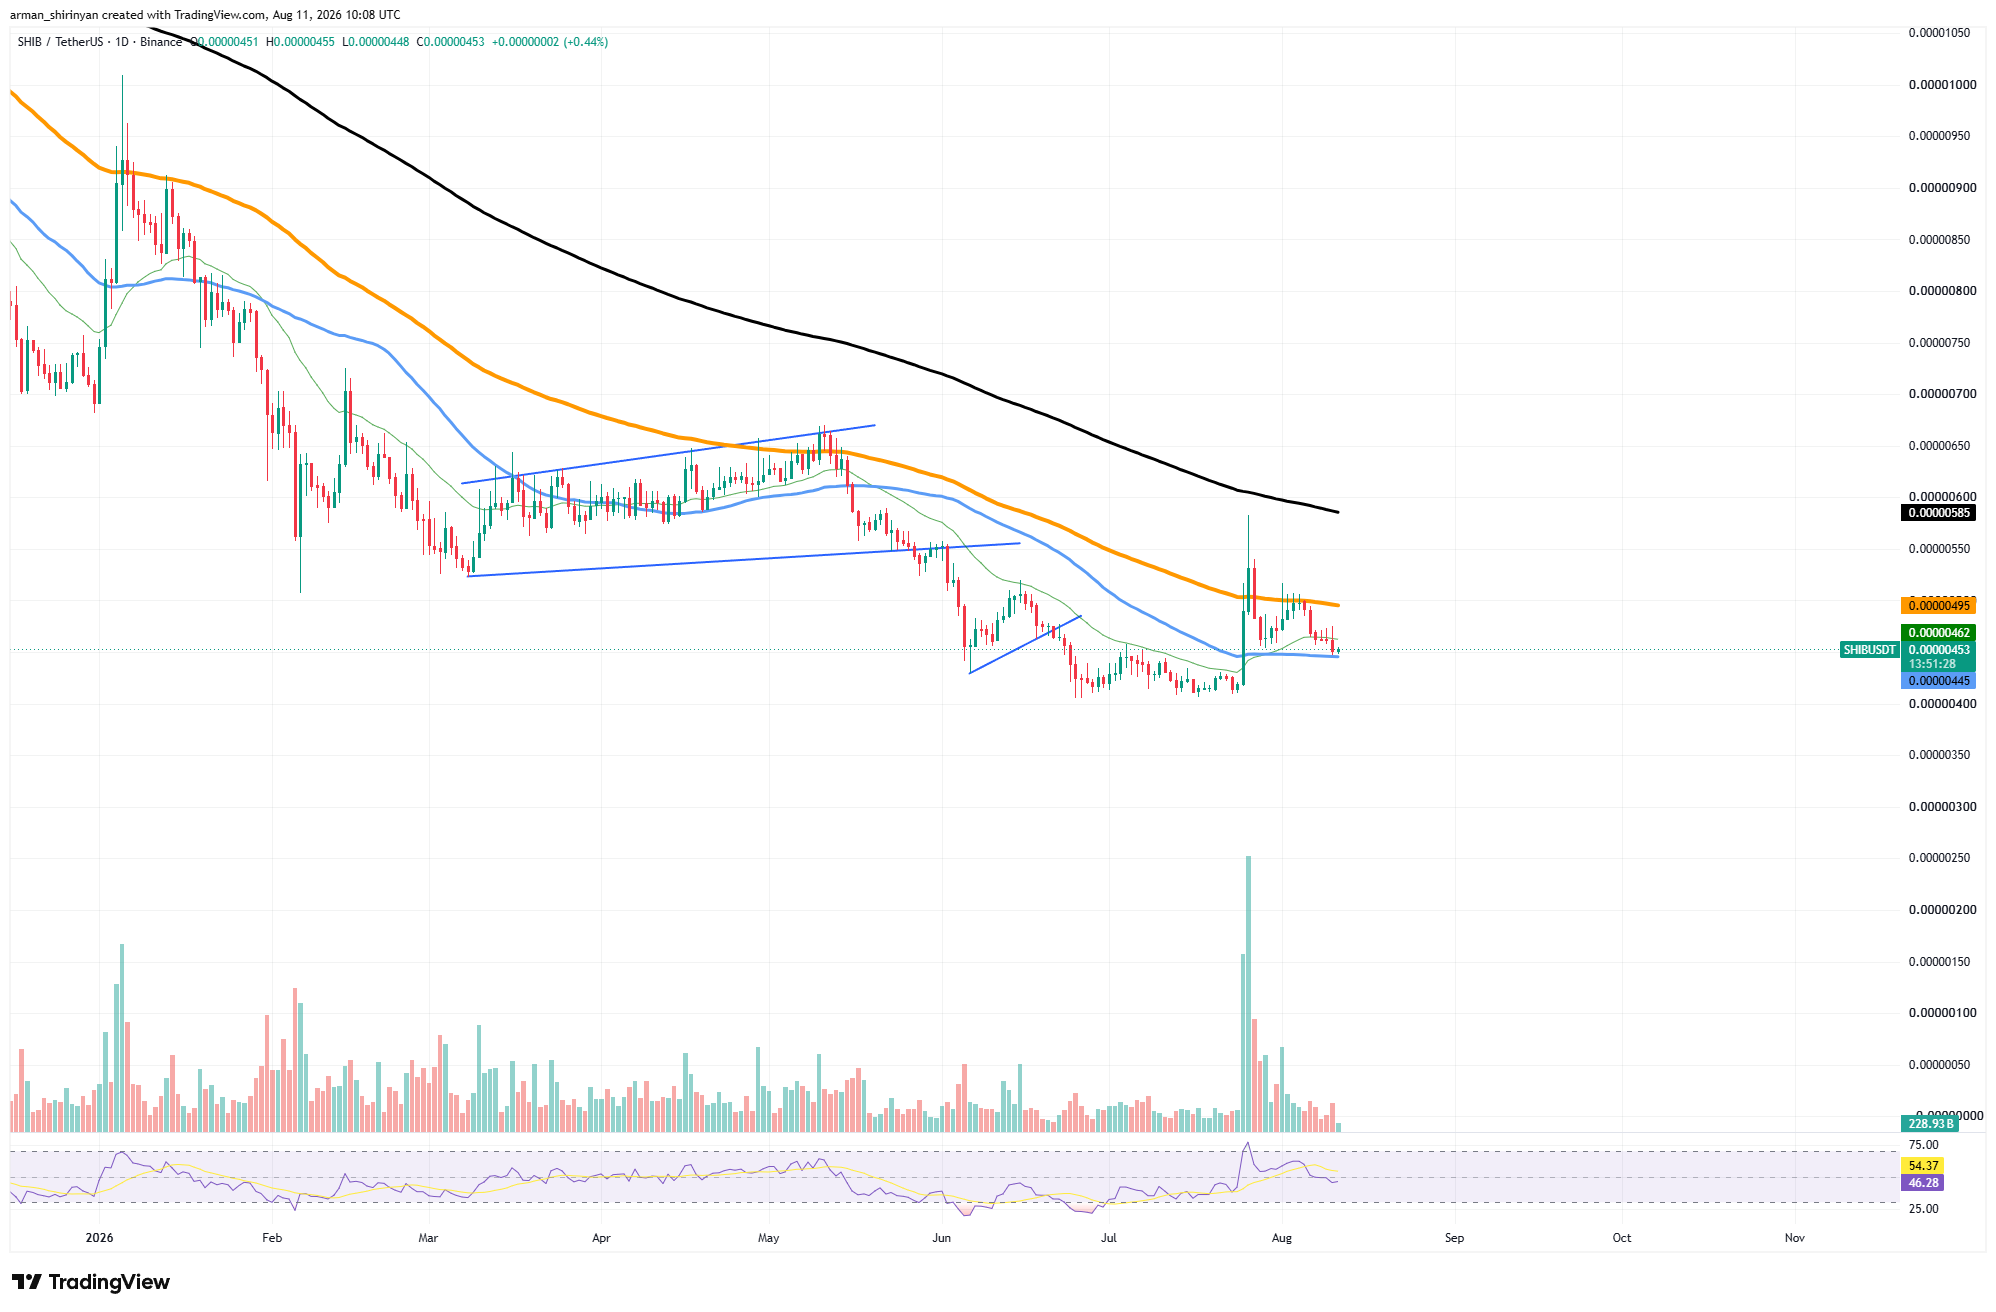
The 12-hour figure was negative by $18,050, while the one-hour spot net inflow was roughly $129,780. This explains why the brief 3,402% increase did not result in a comparable price movement. $SHIB is currently trading at about $0.00000454, down about 3.6% over the last day and nearly 9% over the last seven days.
Additionally, the derivatives market is still quite small, with about $29.5 million in open interest. Particularly among Binance's top traders, long/short ratios are bullish, but positioning alone has not created enough demand to buck the general trend. Technically, there is still significant resistance for $SHIB.
The price is below resistance near $0.00000495 and the long-term average around $0.00000586, but it remains near the shorter moving averages at $0.00000445–$0.00000462. RSI near 54 also indicates neutral-to-moderately bullish momentum rather than a breakout.
As a result, the 3,402% figure indicates an abrupt shift in a modest net-flow balance. It does not imply that $SHIB received 34 times more significant capital, and on its own, it gives little reason to anticipate a shift in the current pricing structure.