
 ambcrypto.com

The Canton Network [CC] token price has fallen nearly 6% in the past 24 hours. Over the past week, it was down 17.75%, and down 24.95% over the past 30 days.
The chain has the highest holders’ revenue over the past 30 days, measuring $55.04 million, according to DeFiLlama data. A burn mechanism ensures all the collected fees are burned.
Yet, the market-wide pessimism and low buying pressure have contributed to the steady losses Canton crypto has faced since June. So far, however, the burn mechanism has not translated into stronger market demand or a sustained price recovery.
Here’s what the price trends look like, and what swing traders and investors need to watch out for next.
Canton crypto falls below $0.10 psychological support level
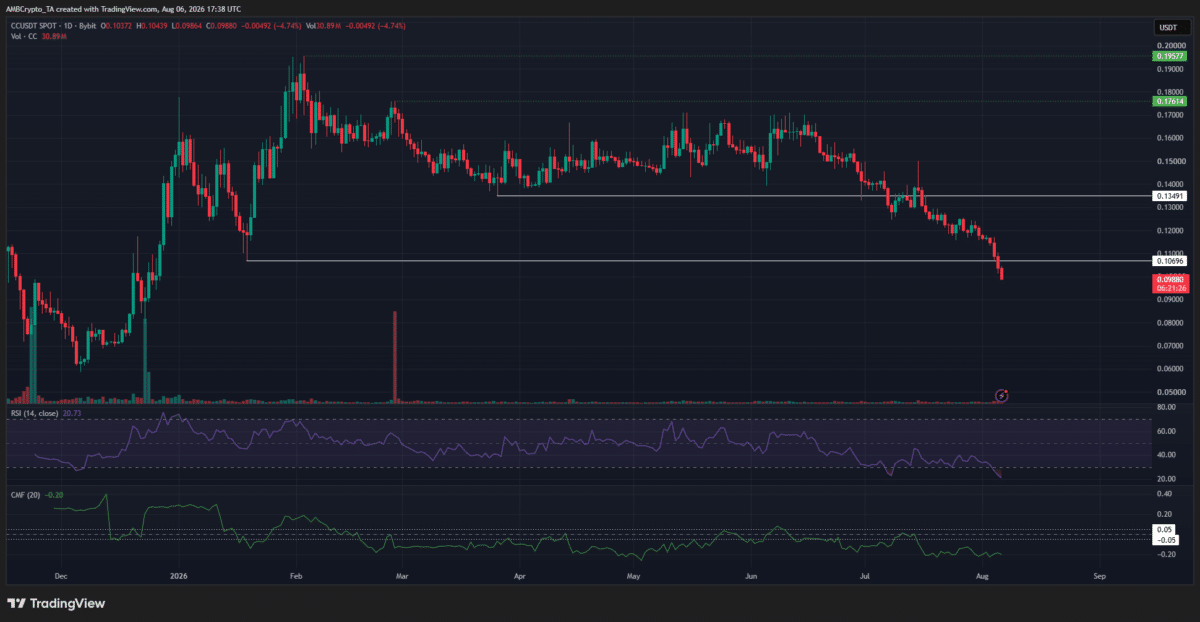
The $0.106 low, made in January earlier this year, has been breached. This low had been the launchpad that took Canton crypto prices to $0.195 in early February. These swing points defined the structure for CC for the rest of the year, till now.
From March to late June, the altcoin was trading between $0.135 and $0.170 for the most part. These two levels also underlined key supply and demand zones.
Over the past month, Canton crypto has been sliding downward steadily. It is possible that profit-taking, low volume, and hence low demand, and the broader risk-off market sentiment were keeping CC prices in a bearish trend.
The CMF was at -0.20 to signal strong capital flows out of the market. The RSI was also at extremes, displaying a deeply oversold value of 20.7 on the 1-day timeframe.
Traders’ call to action- Sell the bounce
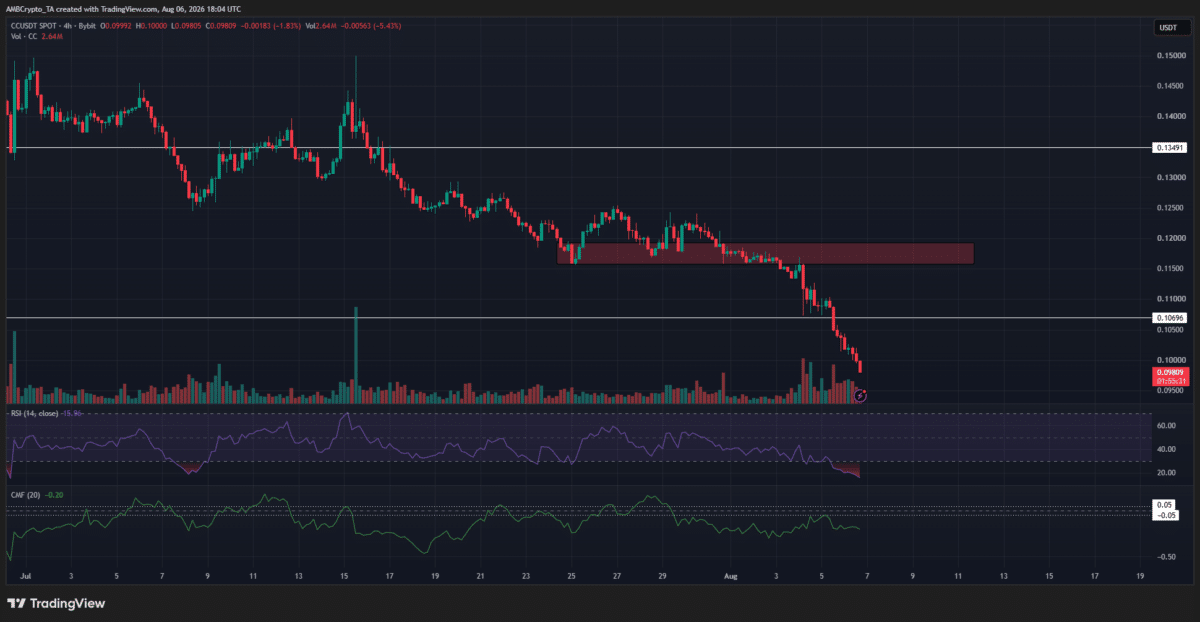
On the 4-hour chart, the technical indicators were just as bearish as on the 1-day timeframe. The RSI was even more deeply oversold. It does not guarantee a bounce by itself.
Traders already in short positions can look to take profits and wait for a bounce to re-enter the market. The $0.100-$0.105 area is a key area, as is the $0.116-$0.119 former support zone.
A test of either region and a subsequent rejection would signal a bearish continuation.
Final Summary
- The technical indicators were firmly bearish across timeframes and agreed that frenzied selling pressure has sent CC toppling beyond key support levels.
- The 4-hour chart saw an uptick in trading volume over the past 72 hours, and CC is down nearly 15% in this period alone.