
 thecryptobasic.com

$XRP looks close to completing its ongoing Wave 2 correction, with the upcoming third wave targeting double-digit levels.
Notably, $XRP has remained under pressure throughout 2026, with the cryptocurrency down nearly 43% since the beginning of the year.
However, chart data suggests the current decline may be nearing its end. Market watcher EGRAG believes $XRP is following an Elliott Wave structure in which the ongoing pullback represents Wave 2. If this outlook proves correct, the next impulsive Wave 3 could lead to $43.83.
$XRP Facing Bullish Divergence
The three-day $XRP chart highlights what appears to be a notable bullish divergence.
Although $XRP has continued to print a lower low, the Relative Strength Index (RSI) has moved in the opposite direction by forming a higher low. This often suggests that sellers are beginning to lose strength, even as prices remain under pressure.
The chart indicates that this divergence shows weakening downside momentum. In other words, the pace of the decline has started to slow despite $XRP still trading within its broader correction.
Bullish divergences often appear near major market bottoms, which makes this one of the main reasons the chart suggests the current decline could be close to ending.
Elliott Wave Structure Suggests Wave 2 Could Be Ending
From an Elliott Wave perspective, the chart favors the view that $XRP is close to completing Wave 2. If this interpretation holds, the current correction could soon give way to the next impulsive phase of the cycle.
However, Wave 3 has not yet been confirmed. $XRP must first break out of its corrective structure and reclaim a major resistance cluster before the next bullish wave can be considered underway. Until then, the bullish divergence acts only as an early signal, not a full confirmation.
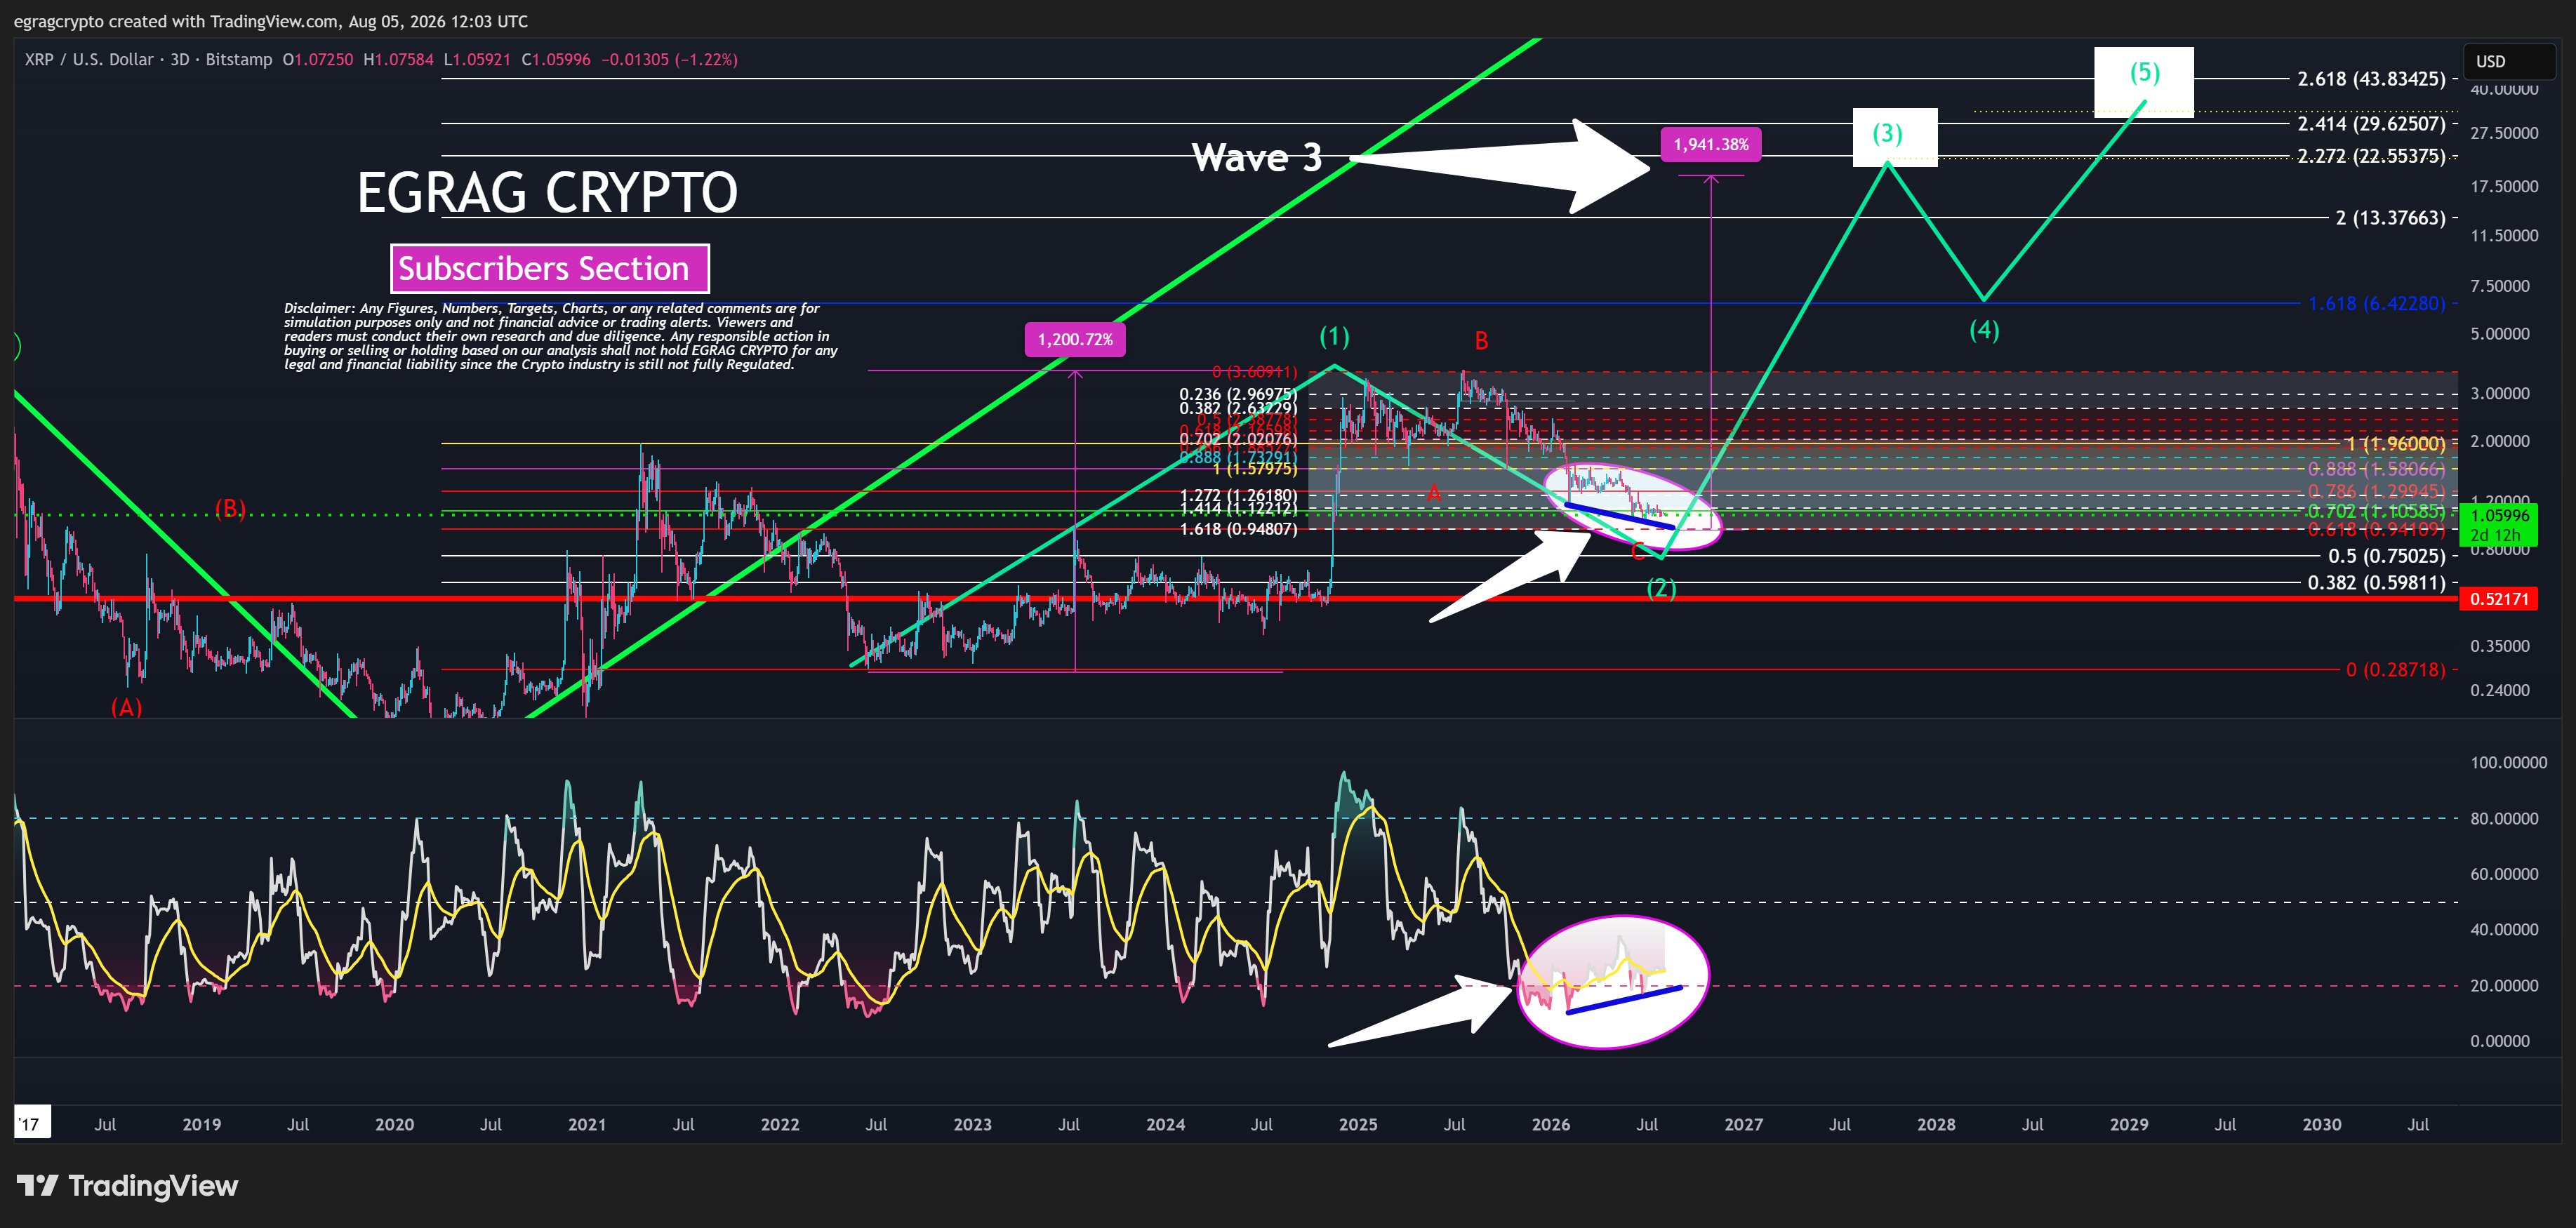
While that confirmation is still pending, the chart identifies several key support levels that could help define the bottom. The first major support zone sits between $1.00 and $0.95. Below that, $0.75 serves as another important level, while the deeper structural support area lies between $0.60 and $0.52 if the decline extends further.
Several Resistance Levels Still Stand in the Way
The bullish outlook could play out only if $XRP continues reclaiming higher price levels. According to the chart, sustained closes between $1.30 and $1.60 would provide the first sign that buyers are regaining control.
Beyond that, $XRP would need to secure closes above $1.96 and later clear the $3.00 to $3.60 resistance zone. The chart identifies a break above the previous Wave 1 high as the strongest confirmation that Wave 3 has begun.
Each of these resistance levels adds more confidence to the bullish outlook. Until $XRP moves above them, the structure remains a developing scenario, not a confirmed breakout.
$XRP Could Target $43 in Wave 3
The projected upside comes from the size of the previous impulsive move. According to the chart, Wave 1 delivered gains of about 1,200%. Since Elliott Wave Theory often identifies Wave 3 as the strongest part of the cycle, $XRP could record a much larger push during the next phase.
Specifically, Wave 3 could produce gains of around 1,900% to 2,000%, which would amount to nearly a 20-fold increase from the expected bottoming region. Based on that projection, the long-term targets include $6.42, $13.37, $22.55, $29.63, and finally $43.83.
Despite these ambitious targets, price confirmation remains the deciding factor. The bullish divergence suggests $XRP may be forming a bottom, but the asset still needs to break above its corrective structure before Wave 3 can be confirmed.