
 en.cryptonomist.ch
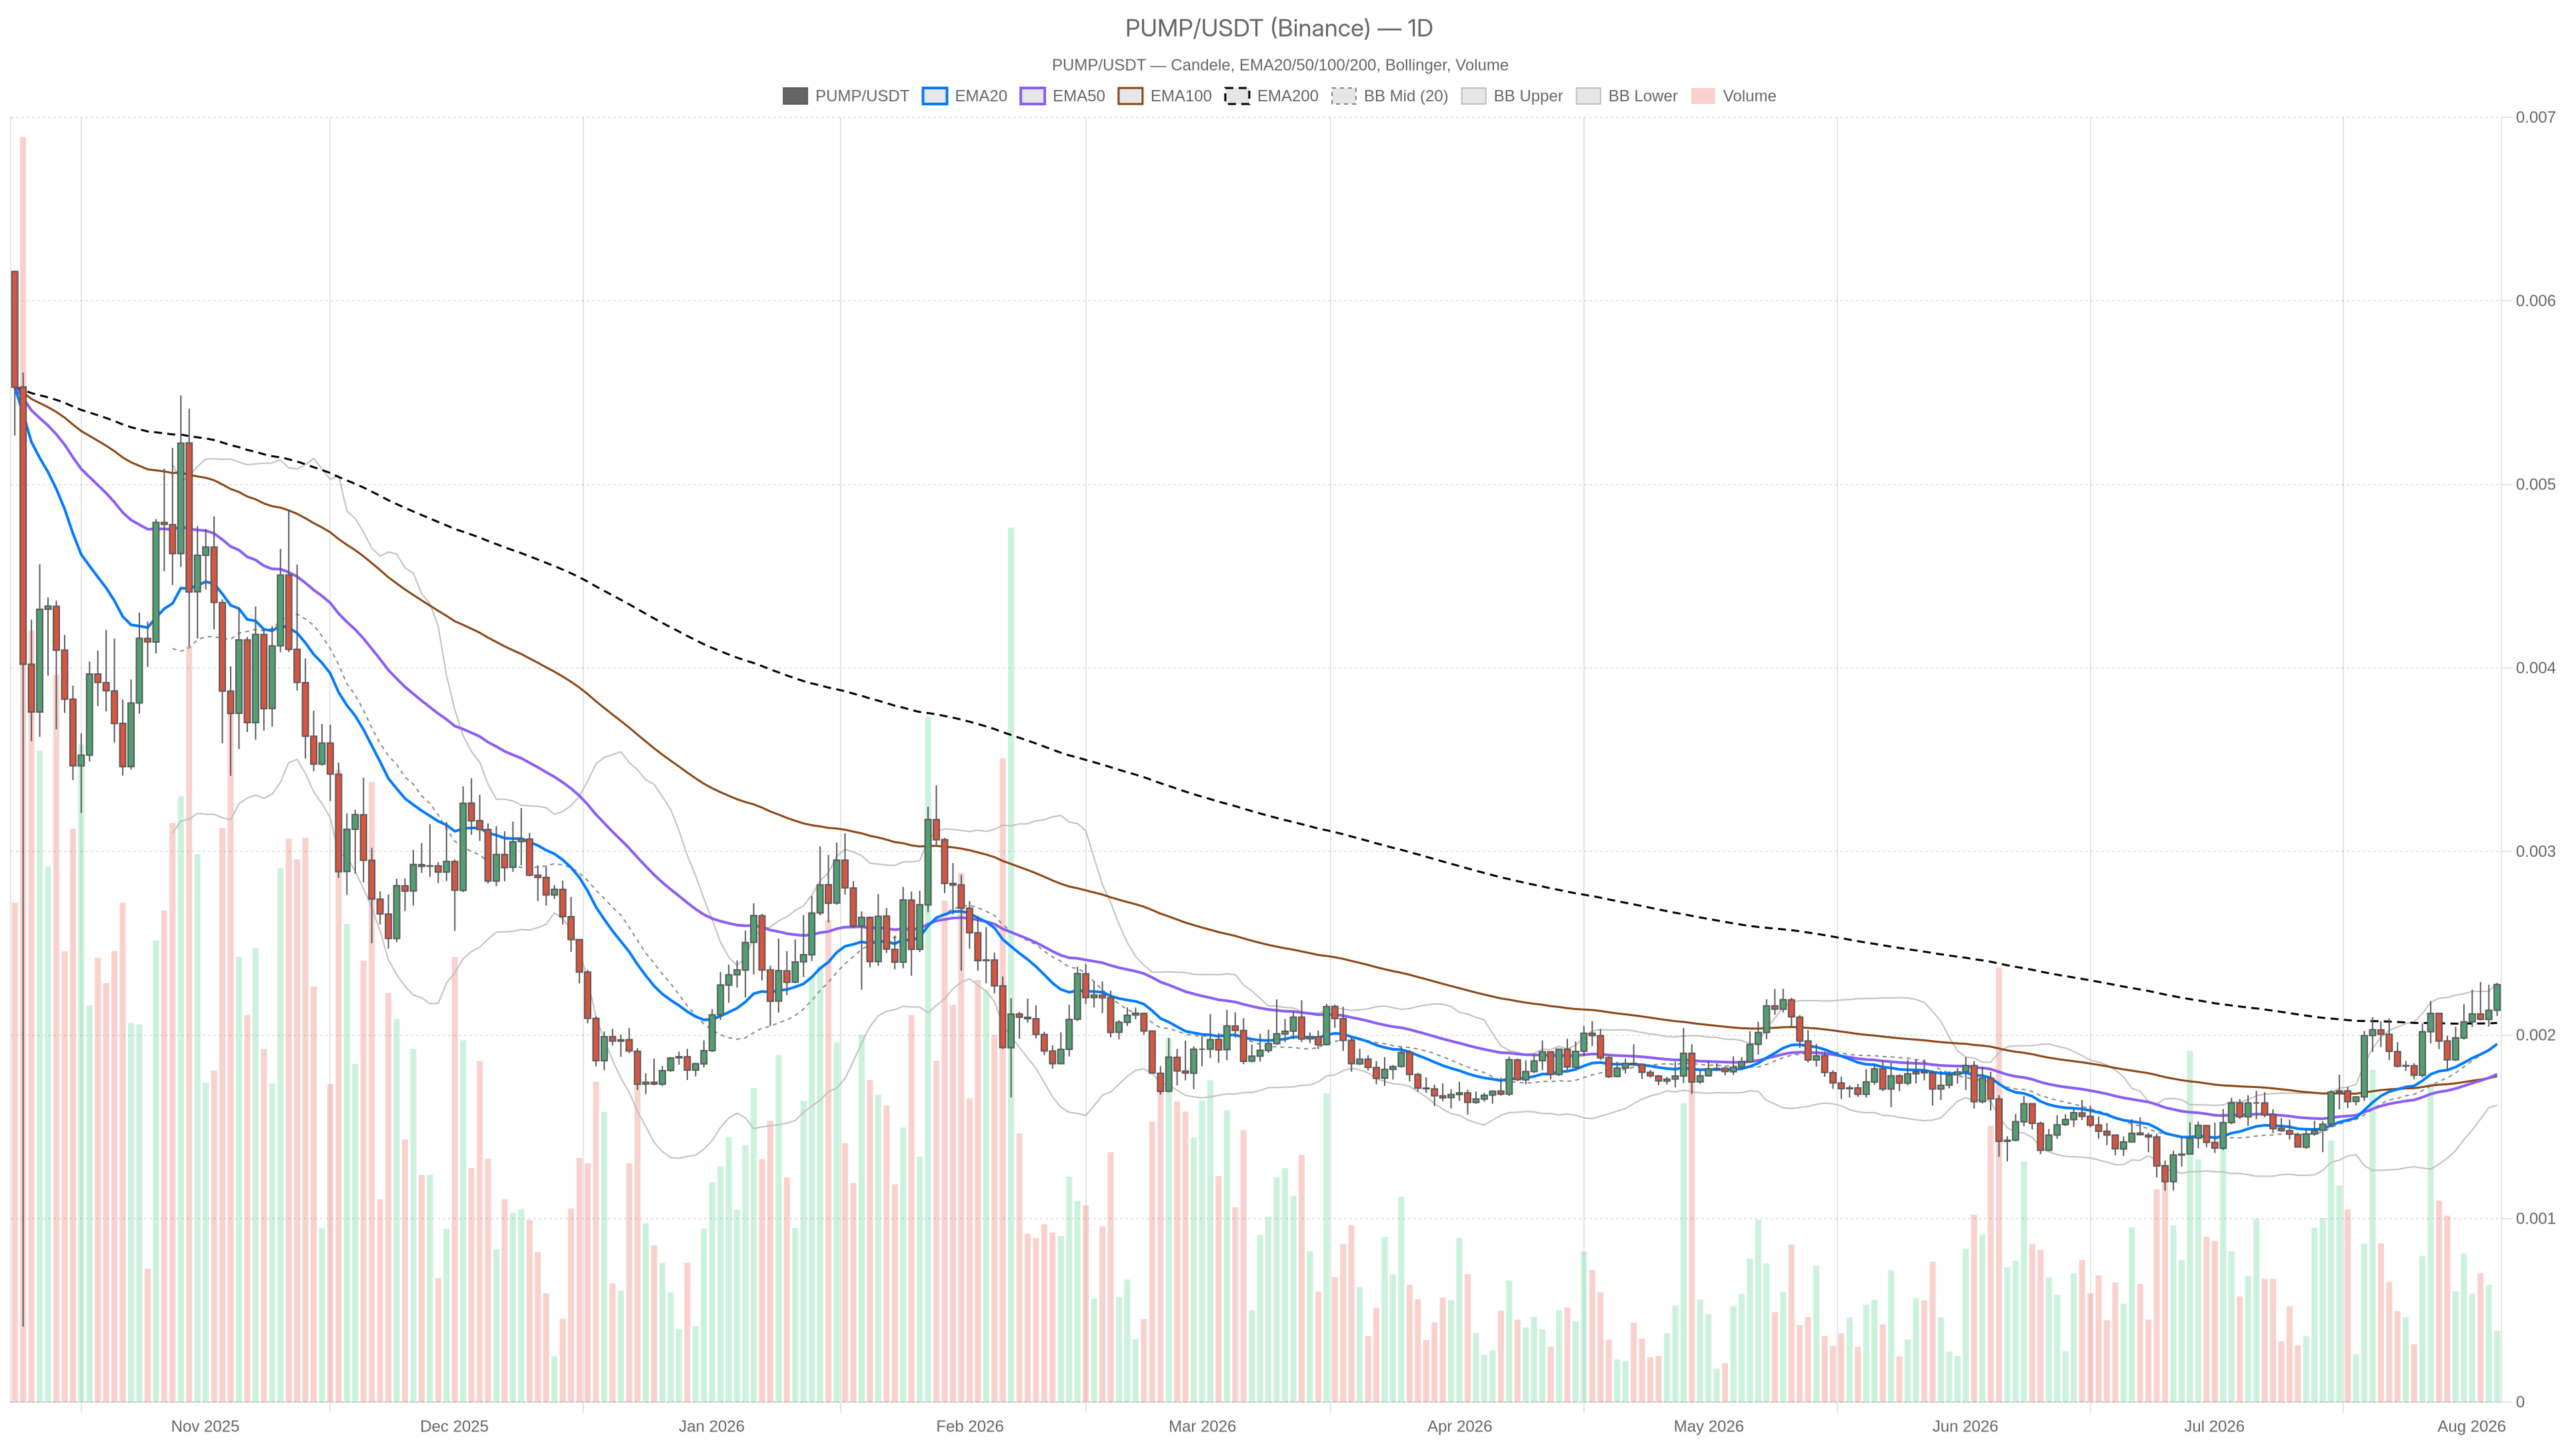
As of August 4, 2026, the Pump.fun crypto token ($PUMP) sits in a setup that makes traders uneasy rather than confident: momentum readings across every timeframe point higher, yet the broader market mood is stuck in Extreme Fear.
Key takeaways
- $PUMP daily RSI14 sits at 67.54, approaching overbought territory while the daily trend regime remains neutral.
- The Fear & Greed Index reads 25 (Extreme Fear), signaling defensive conditions across the crypto market.
- Both H1 and M15 timeframes show bullish regimes with RSI readings above 64, confirming short-term momentum.
- $BTC dominance at 56.6% and total market cap near $2.27 trillion suggest capital remains concentrated in Bitcoin.
Daily Structure: Momentum Ahead of Trend Confirmation
On the daily chart, $PUMP’s RSI14 at 67.54 tells you buyers have been in control and the pace of buying has approached overbought conditions. However, the regime tag is neutral, not bullish — meaning the broader daily trend structure has not caught up with that momentum yet. In practice, this divergence shows up when a market stretches within a range rather than breaking into a clean uptrend. Momentum alone rarely sustains a move if the higher timeframe structure is not backing it.
That gap between hot RSI and a neutral regime label is the single most important thing to watch for $PUMP right now. If the daily regime eventually flips to bullish while RSI holds in this zone, it would confirm that momentum is finally translating into trend. If instead RSI starts rolling over while the regime stays neutral, it suggests the recent push was more of a localized spike than the beginning of a durable move.
Intraday Timeframes: H1 and M15 Are Aligned, But Are They Leading or Lagging?
Zooming into the 1-hour chart, the regime is tagged bullish with RSI14 at 64.96 — still elevated, still leaning toward buyers, but noticeably cooler than the daily reading. The 15-minute chart tells a nearly identical story: bullish regime, RSI14 at 64.17. Both intraday timeframes agree with each other, which at least removes one layer of confusion. The tension is not between H1 and M15 — it is between these confirmed bullish intraday regimes and the daily chart’s neutral stance.
That said, this kind of setup often shows up during bounces inside a larger consolidation rather than the early stage of a fresh macro trend. It does not mean the move is fake. It means the burden of proof is still on the bulls to get the daily structure to follow through, and until that happens, traders should treat the intraday strength as tactical rather than structural.
The Market Backdrop $PUMP Is Trading Against
Context matters here. According to CoinGecko figures, total crypto market capitalization sits near $2.27 trillion, up a modest 0.50% over 24 hours — not a risk-on surge, just mild positive drift. Bitcoin dominance is elevated at roughly 56.6%, which typically signals that capital is concentrated in $BTC rather than rotating aggressively into altcoins. For a token like Pump.fun crypto, that dominance level is a headwind: sustained altcoin rallies usually need dominance to ease, not climb.
Moreover, layer on the Extreme Fear reading of 25, and you get a market that is technically calm on the surface but psychologically defensive underneath. Broader macro headlines are not helping the mood either — reports that a cornered Trump administration could turn on Big Oil, as covered by Bloomberg, are part of the kind of macro noise that keeps traders cautious even when it has nothing directly to do with crypto. None of this is $PUMP-specific, but it is the water $PUMP is swimming in, and it explains why intraday bullish momentum has not yet convinced the daily chart to commit.
Bullish Scenario
If H1 and M15 keep their bullish regimes intact and RSI on both timeframes holds above the 60 area without diverging lower, that is the first sign intraday strength has staying power. The real confirmation would be the daily regime flipping from neutral to bullish while RSI stays elevated rather than immediately fading. That combination would suggest $PUMP is transitioning from a range-bound bounce into an actual trend leg. A softening of Extreme Fear sentiment and any easing in $BTC dominance would add fuel, since capital would have room to rotate toward assets like $PUMP rather than staying parked in Bitcoin.
What would invalidate this: if RSI on the daily starts turning down from these overbought-adjacent levels while the intraday regimes lose their bullish tag first — that sequencing (weakness starting on lower timeframes) is usually the earliest tell that a bounce is running out of road.
Bearish Scenario
On the other hand, the case for caution starts with the daily regime itself — neutral, not bullish — despite RSI already near 67-68. That is a classic setup for mean reversion: momentum extended, but structure unconvinced. Combine that with Extreme Fear at 25 and $BTC dominance sitting above 56%, and you have a macro backdrop that does not naturally support altcoin follow-through. If H1 and M15 RSI start slipping from their current mid-60s readings while price stalls rather than pushing higher, that would signal the intraday bullish push is losing steam and the daily’s neutral bias is reasserting itself.
What would invalidate this: continued RSI strength across all three timeframes with H1 and M15 holding their bullish regimes and the daily eventually confirming bullish too — that would undercut the mean-reversion argument and favor trend continuation instead.
Positioning and Risk
This is not a setup with a clean, one-directional story. $PUMP’s own momentum indicators are constructive across every timeframe checked, but the daily chart has not confirmed a trend shift, and the broader market sits in Extreme Fear with capital concentrated in Bitcoin. That combination calls for patience rather than conviction in either direction.
Anyone watching this pair should pay close attention to whether the daily regime eventually aligns with the intraday bullish reads, or whether RSI momentum fades before that alignment happens. That sequencing will likely decide which scenario plays out. Volatility around sentiment extremes like a Fear & Greed reading of 25 tends to cut both ways, and given the mixed signals here, position sizing and risk management matter more than usual until the daily and intraday timeframes start telling the same story.
FAQ
What is the current RSI for $PUMP on the daily chart?
As of August 4, 2026, $PUMP’s daily RSI14 stands at 67.54, approaching overbought levels while the daily trend regime remains classified as neutral.
Why does the Fear & Greed Index matter for $PUMP’s price outlook?
The Fear & Greed Index at 25 (Extreme Fear) reflects defensive sentiment across the broader crypto market, which typically does not support fresh breakouts for altcoins like $PUMP.
Are the intraday timeframes bullish or bearish for $PUMP?
Both the 1-hour and 15-minute charts show bullish regimes with RSI14 readings of 64.96 and 64.17 respectively, indicating short-term momentum currently favors buyers.
What needs to happen for a confirmed bullish breakout?
The daily regime would need to flip from neutral to bullish while RSI holds elevated, and ideally Extreme Fear sentiment would ease alongside any softening in $BTC dominance.
Disclaimer: This article is for informational purposes only and does not constitute financial advice, an investment recommendation, or a solicitation to buy or sell any financial instrument or cryptocurrency. The analysis provided is not indicative of future results. Investing in crypto assets and financial markets carries a high risk of capital loss. Always do your own research (DYOR) and consult a qualified financial advisor before making any decision.
Article produced with the assistance of artificial intelligence and reviewed by the editorial team.