Daily Chart: The Bearish Case Is Still Intact
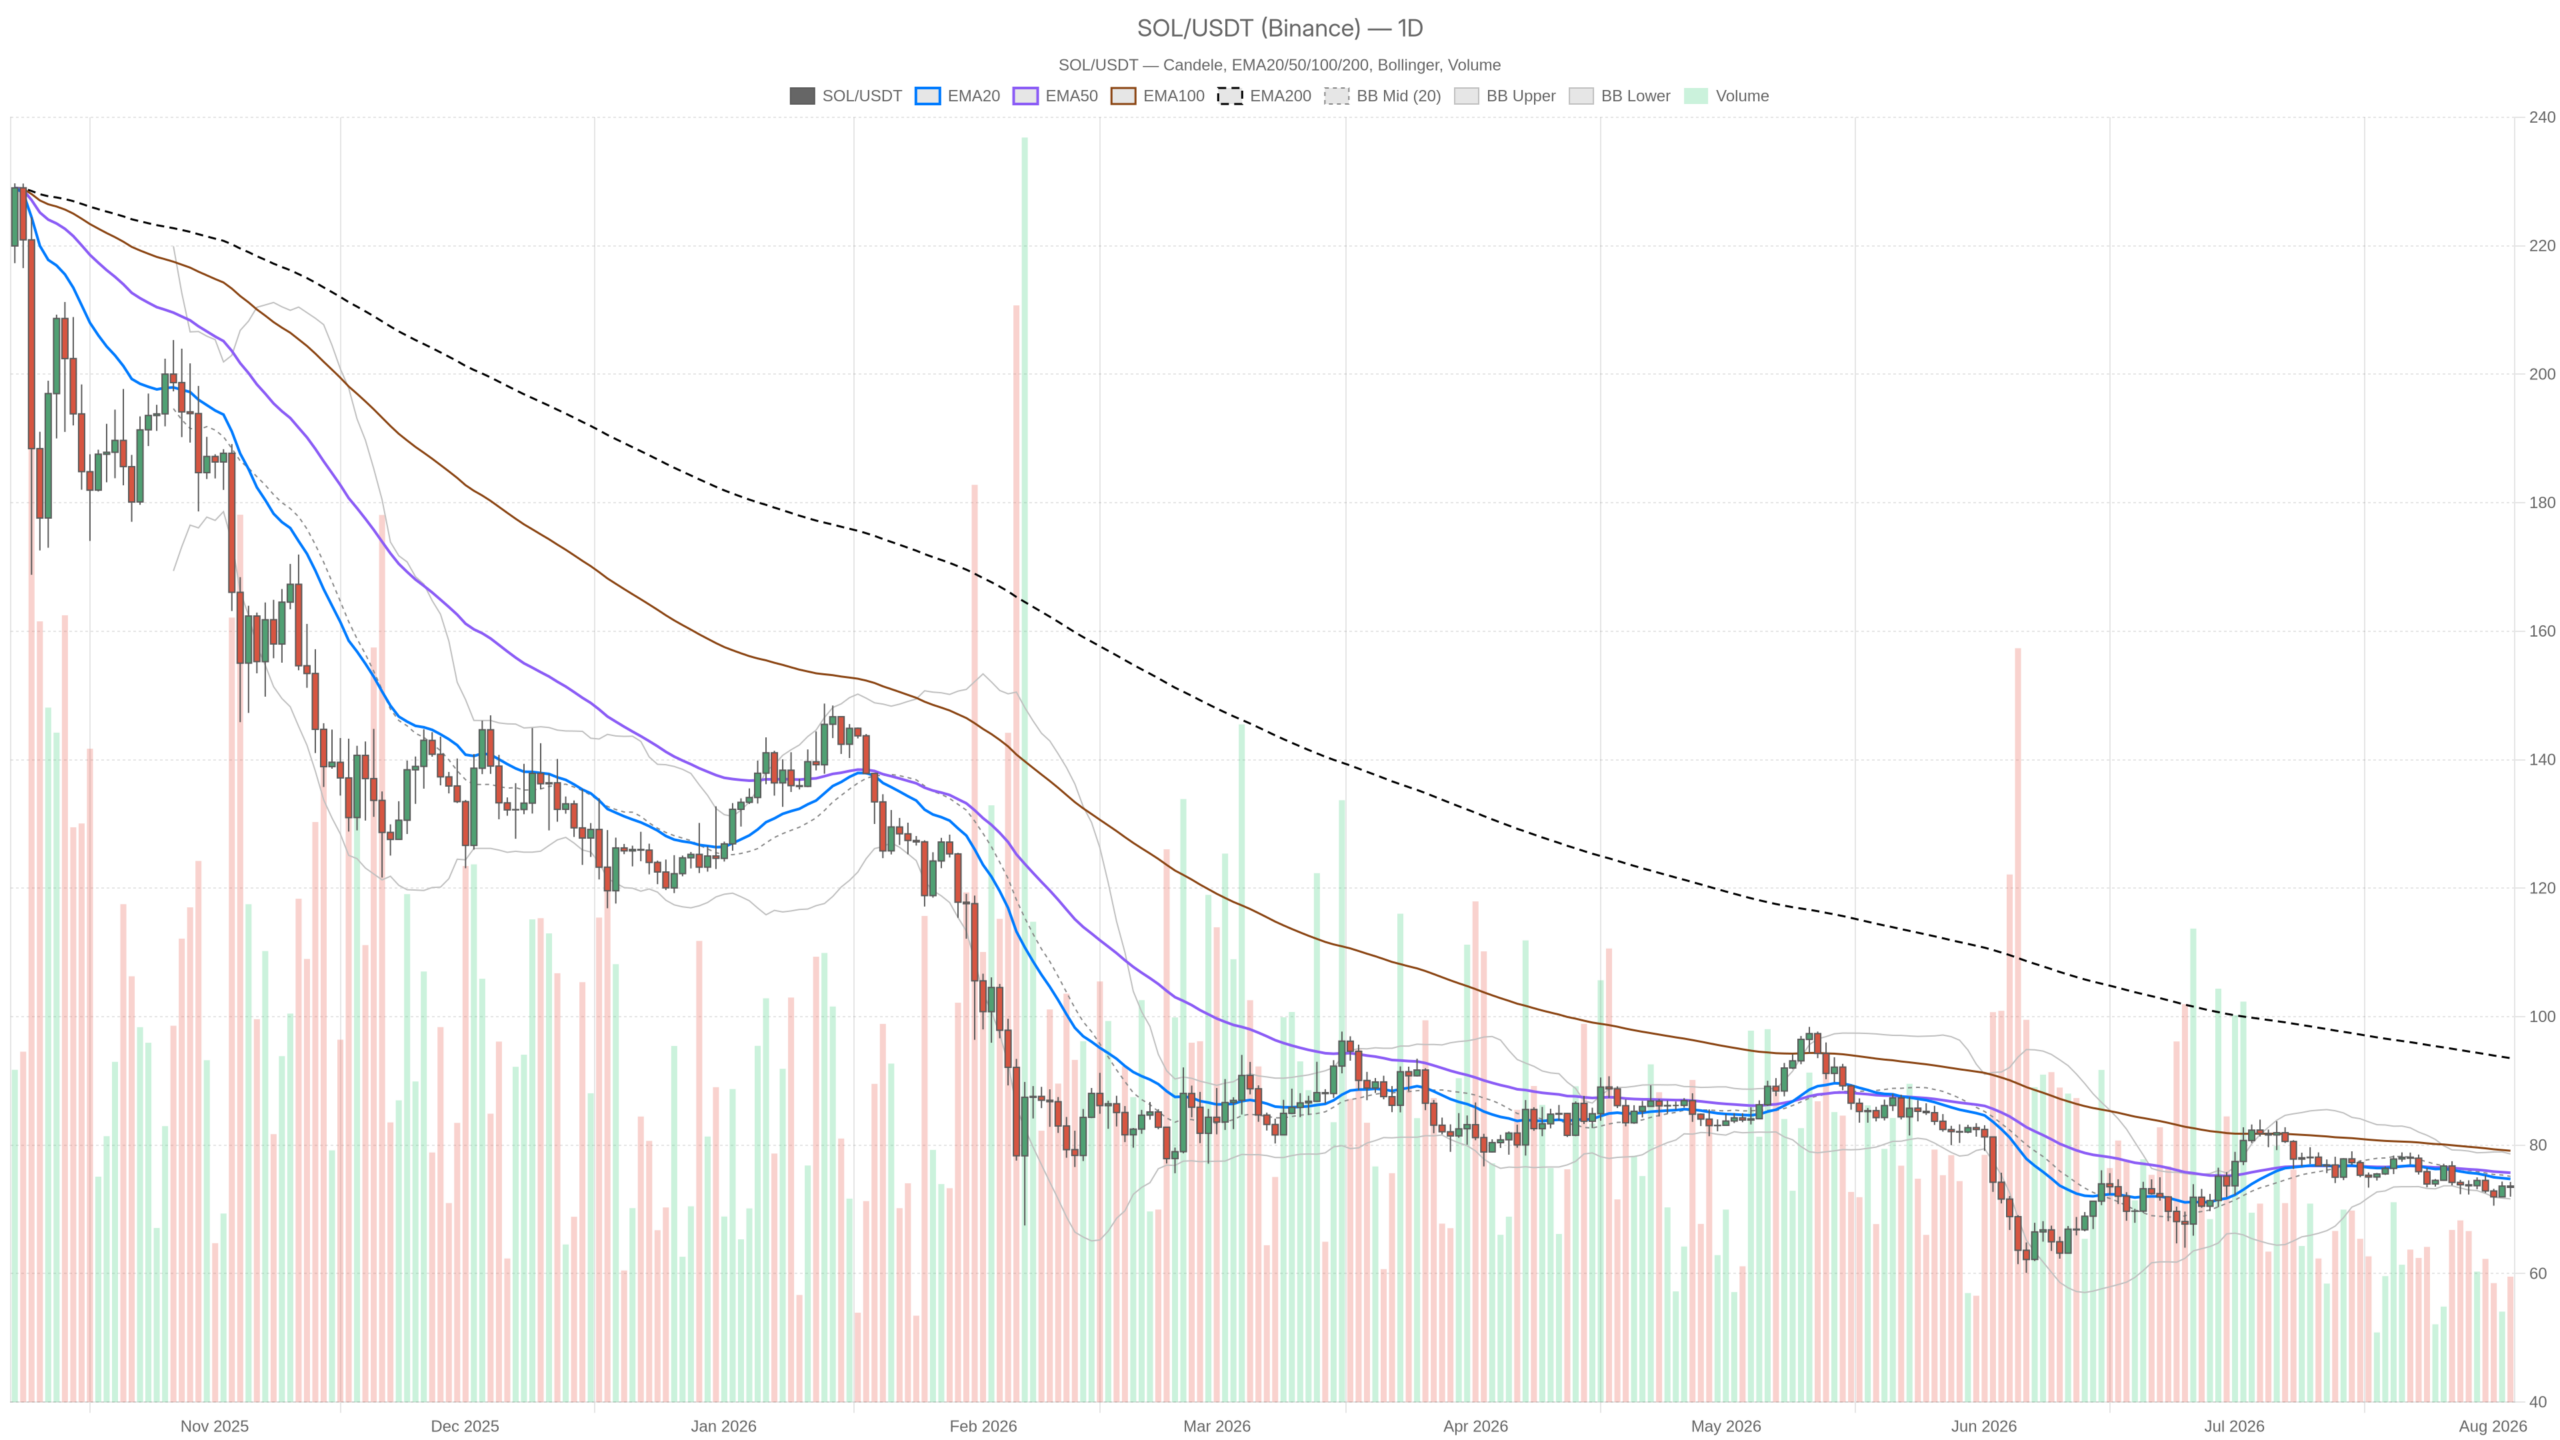
The daily chart for Solana crypto remains firmly bearish, with $SOL trading below all major moving averages — a textbook long-term downtrend signature. Price currently sits beneath the EMA20 at $74.74, the EMA50 at $75.7, and dramatically below the EMA200 at $93.55, which is nearly $20 above spot. Until $SOL reclaims the 74-76 cluster, rallies should be treated as counter-trend moves rather than genuine reversals.
However, the daily RSI at 44.91 is neither oversold nor overbought. Combined with the MACD reading — line at -0.83, signal at -0.51, and histogram at -0.31 — it confirms that downside momentum has not been neutralized. The histogram remains negative and slightly widening, indicating sellers still hold a marginal edge. Meanwhile, daily Bollinger Bands frame the current range with the mid-band at 75.14, upper at 78.63, and lower at 71.64, placing price squarely in the lower half of the band.
Moreover, the ATR14 on the daily timeframe comes in at 2.38, providing useful context for stop placement and target sizing. The daily pivot structure — pivot point at 73.23, R1 at 74.49, and S1 at 72.19 — places current price almost exactly on the pivot, a configuration that often signals indecision building at a key inflection level.
Short-Term Charts Tell a Different Story
The 1-hour chart offers a more constructive picture, with the regime flagged as neutral and price consolidating within a tight EMA cluster. $SOL at 73.43 sits almost directly on its EMA20 at 73.38 and EMA50 at 73.22, just below the EMA200 at 73.82 — a compression that typically signals consolidation rather than trending behavior. The RSI14 at 52.09 sits right in the middle of the range, while the MACD has flipped positive, hinting at a modest momentum recovery fighting against the heavier daily downtrend.
That said, this tension between timeframes is worth flagging explicitly: the daily chart says sellers remain in control, but the 1H chart shows buyers stepping in enough to stabilize price and nudge momentum positive intraday. That is not uncommon in a downtrend — bounces happen — but anyone trading $SOL right now needs to respect both narratives simultaneously rather than picking whichever one feels more convenient.
The 15-minute chart adds execution-level nuance. RSI14 has dropped to 37.78, closer to oversold territory, while the MACD histogram is negative again at -0.09, suggesting the most recent short-term push has run out of steam. Price sits below its 15m EMA20 at 73.76 but above its EMA200 at 73.17, forming a classic pullback-within-consolidation pattern. This timeframe mainly signals that a small give-and-take is underway around the $73.3-73.6 pivot zone.
DeFi Fee Data Shows Growing Activity
Meanwhile, on-chain data reveals that Solana’s DEX ecosystem has experienced a meaningful pickup in short-term trading activity, even as the token price remains under pressure. Raydium AMM fees surged 87.22% over 24 hours and are up 69.74% over seven days, despite a 30-day decline of -26.11%. Orca DEX shows a similar pattern: +35.45% daily and +77.79% weekly, offset by a -25.54% monthly figure. HumidiFi stands out with fees up 117.56% over the past week, alongside a 73.73% gain over 30 days — the strongest sustained trend among the group.
PumpSwap, by contrast, is down -3.45% daily but still up 25.98% weekly. BisonFi rounds out the picture with a 41.35% daily gain and 10.22% weekly, though its 30-day figure is down sharply at -39.37%. Taken together, this fee data suggests short-term trading activity on Solana’s DeFi rails has picked up meaningfully in the past week, even if the monthly trend for several protocols remains negative. Network usage and token price do not always move in lockstep.
Bullish Scenario
For bulls to gain real traction, $SOL must reclaim the daily EMA20 at 74.74 and hold above the daily pivot at 73.23 with conviction, ideally pushing through R1 at 74.49. If the 1H MACD’s positive histogram translates into sustained buying that lifts price toward the daily Bollinger mid-band at 75.14, that would begin to challenge the bearish daily regime. A close back above the EMA50 at 75.7 would deliver the first real technical dent in the downtrend narrative.
Bearish Scenario
On the flip side, the bearish case remains the path of least resistance as long as $SOL stays under its daily EMA20 and EMA50. A break below the daily S1 at 72.19, and especially below the lower Bollinger Band at 71.64, would confirm sellers are back in control. That could open the door toward testing lower support, with the daily ATR of 2.38 suggesting moves of that magnitude fall well within normal range. The 1H neutral regime failing — RSI rolling back under 50 and MACD flipping negative — would serve as the early warning that short-term stabilization has ended.
What This Means for Traders
$SOL right now sits in a market where the daily trend and hourly momentum pull in opposite directions. The Fear & Greed reading of 28 shows broader sentiment remains cautious, while Bitcoin dominance near 56.37% confirms capital rotation into altcoins has not materialized. Yet $SOL’s own DEX ecosystem is generating real short-term fee growth. That combination — technical weakness on the higher timeframe, tentative intraday stabilization, and mixed fundamental signals — creates precisely the kind of environment where volatility can cut either way quickly. Position sizing and respecting invalidation levels on both sides matter far more than predicting which narrative resolves first.
FAQ
What is the current outlook for Solana?
As of August 3, 2026, $SOL trades near $73.44 with a bearish daily structure — price sits below the EMA20, EMA50, and EMA200. Short-term charts show tentative stabilization, but the broader downtrend remains intact until $SOL reclaims the $74-76 resistance cluster.
What are the key support and resistance levels for $SOL?
Key resistance sits at $74.74 (daily EMA20), $75.7 (EMA50), and $93.55 (EMA200). Support levels include the daily S1 at $72.19 and the lower Bollinger Band at $71.64. The daily pivot point at $73.23 serves as a near-term inflection level.
Is Solana’s on-chain activity growing despite the price weakness?
Yes. DEX fee data shows Raydium AMM fees up 87.22% daily, Orca up 35.45%, and HumidiFi up 117.56% over seven days. Short-term DeFi activity has picked up meaningfully even though the token price remains under pressure.
What do the Fear & Greed Index and Bitcoin dominance signal?
The Fear & Greed Index at 28 indicates cautious market sentiment, while Bitcoin dominance at 56.37% shows capital is parked defensively in BTC rather than rotating into altcoins like $SOL. Both metrics reinforce the challenging environment for altcoin price appreciation in the near term.
Disclaimer: This article is for informational purposes only and does not constitute financial advice, an investment recommendation, or a solicitation to buy or sell any financial instrument or cryptocurrency. The analysis provided is not indicative of future results. Investing in crypto assets and financial markets carries a high risk of capital loss. Always do your own research (DYOR) and consult a qualified financial advisor before making any decision.
Article produced with the assistance of artificial intelligence and reviewed by the editorial team.

 en.cryptonomist.ch