Mid-term Historical Data Suggests How XRP Could Perform in August and September 2026
thecryptobasic.com
31 July 2026 09:25, UTC
Historical data on how $XRP has historically performed in midterm years provide hints into how the asset could perform in August and September 2026.
$XRP remains under selling pressure after falling from its July 2025 peak of $3.60. The token currently trades at $1.07, leaving it down by more than 70% from the high it reached last July. The extended decline has kept market sentiment weak, with investors awaiting signs of a recovery.
$XRP Following a Familiar Pattern in Mid-term Years
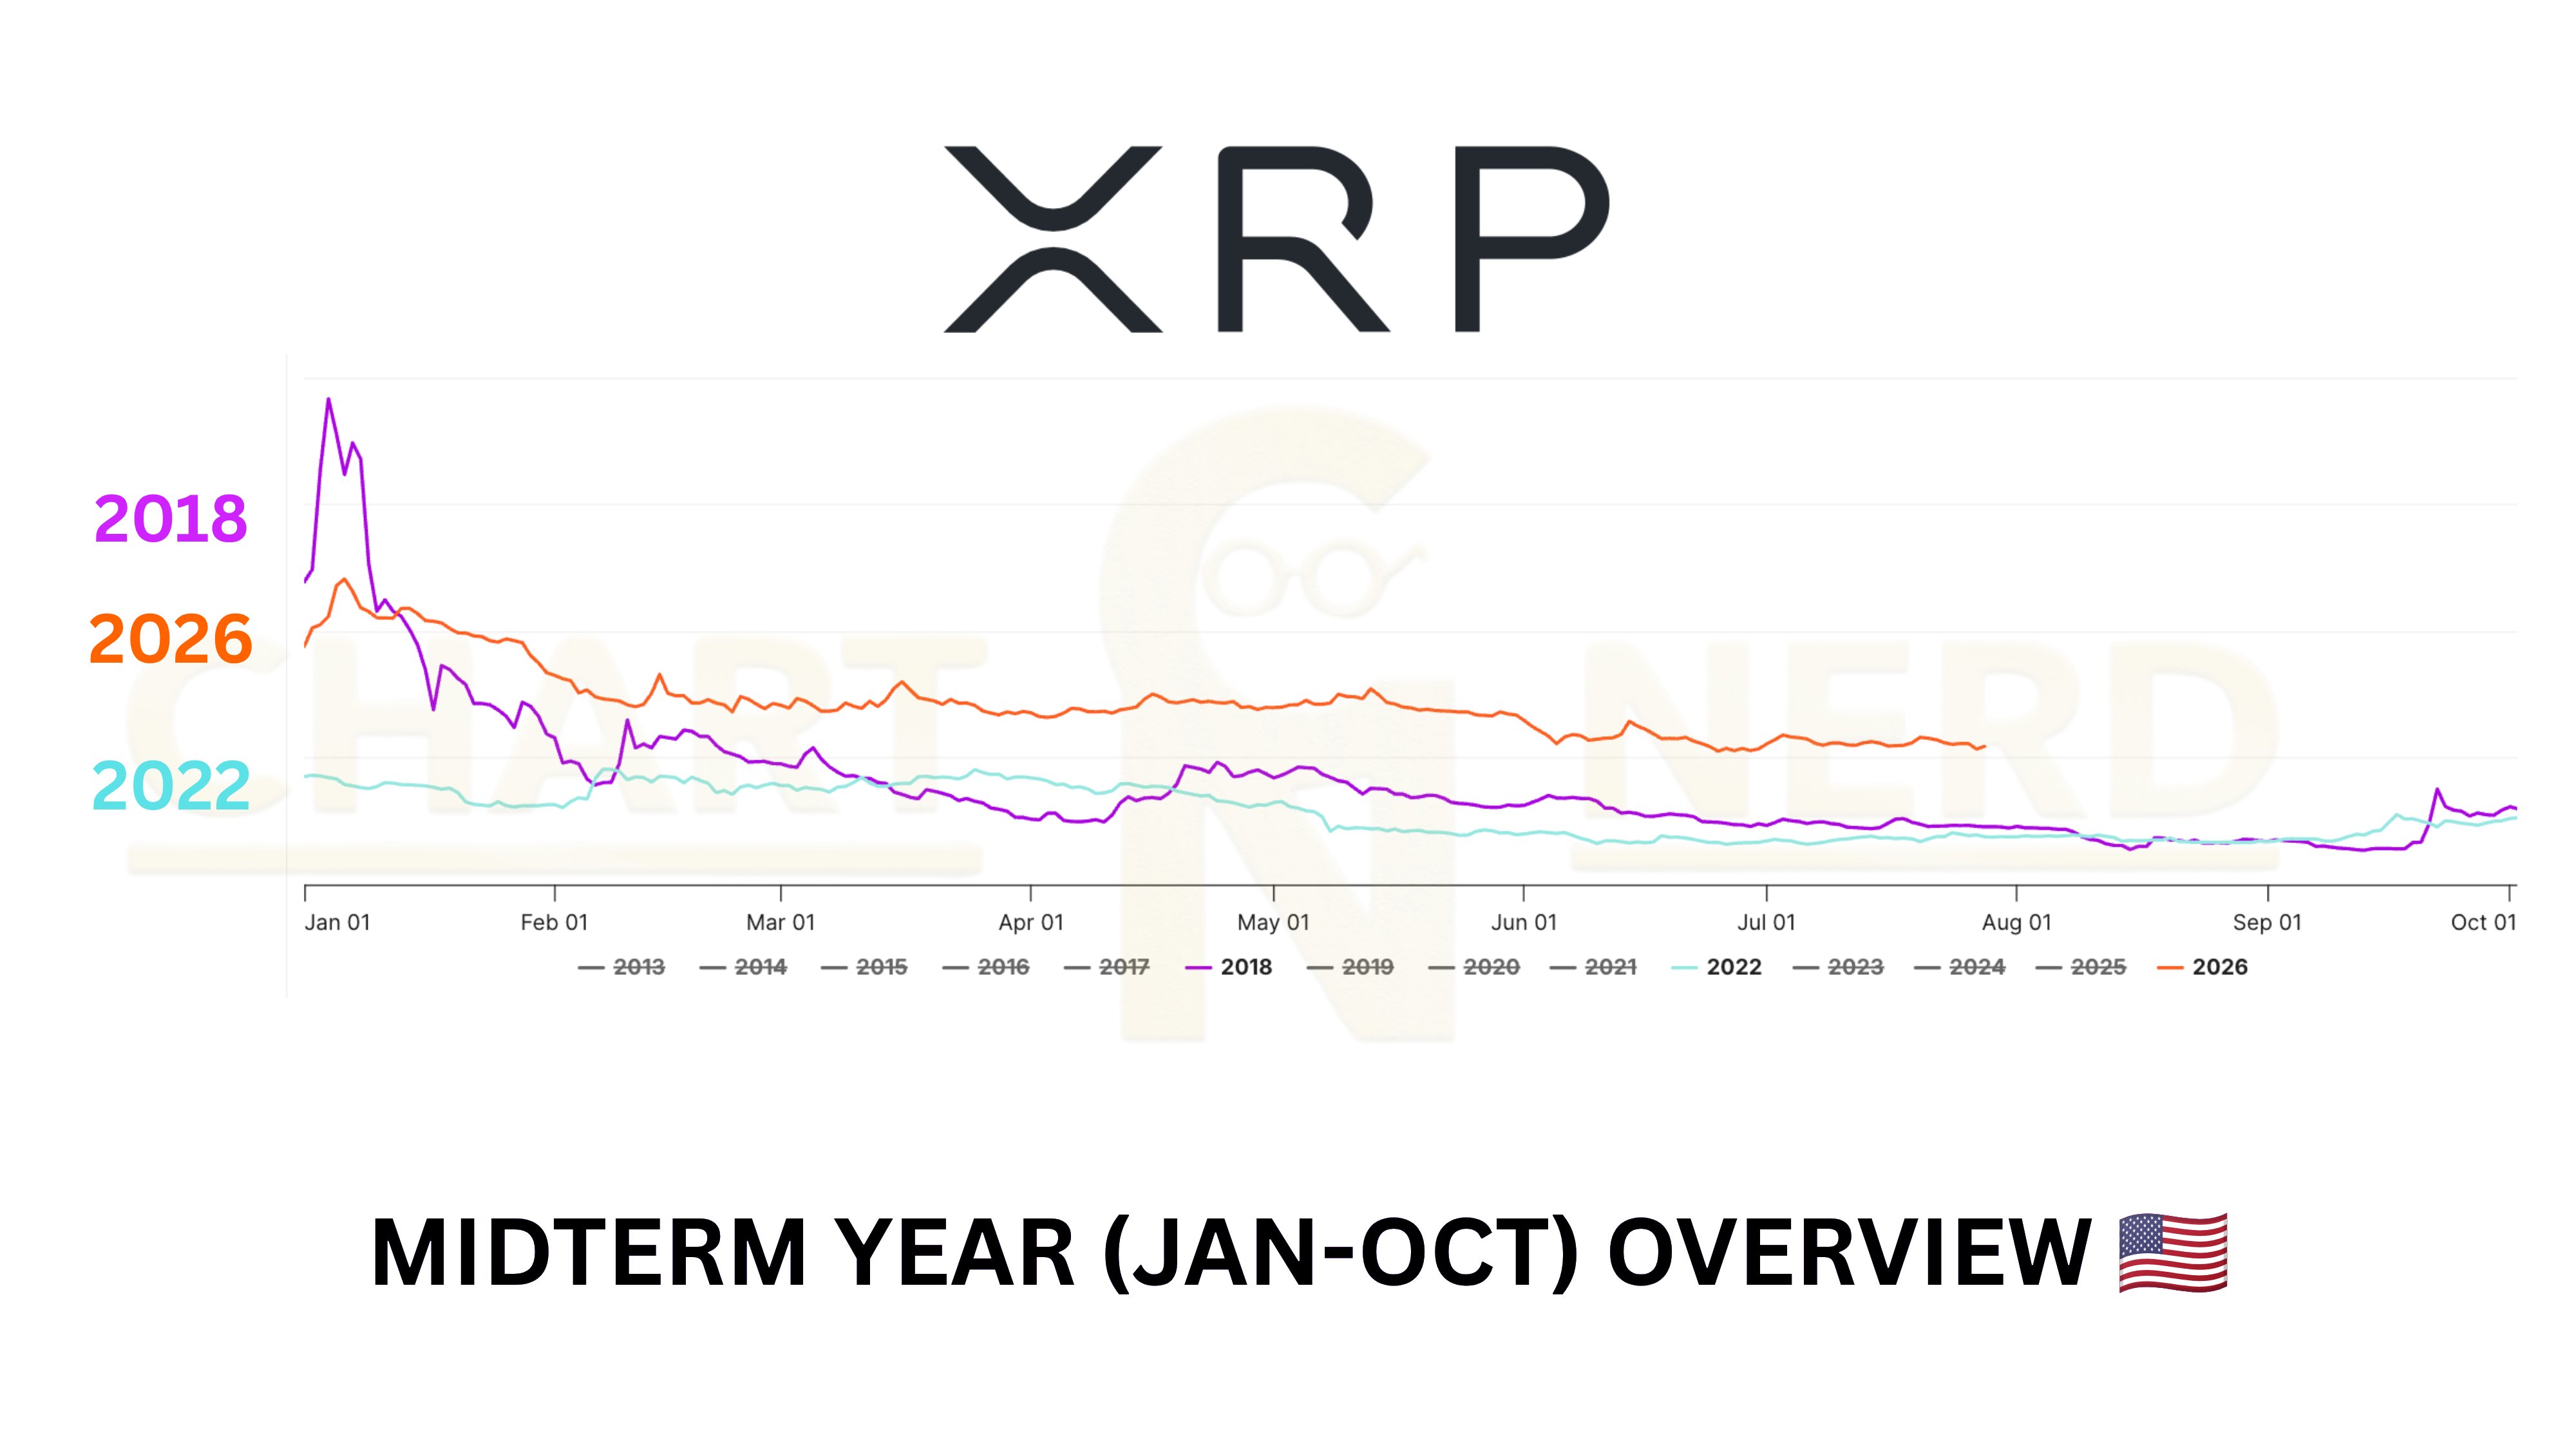
As the downtrend moves into its 12th month, historical chart data suggests a possible repeat of past market cycles. Previous trends suggest $XRP could face another month of losses in August 2026 before recovering part of its decline in September.
Know when your coins move
Alerts, real-time prices, and market news — all in one app
4.8 based on 40K reviews in the App Store and Google Play
Data from previous market cycles show that $XRP has regularly struggled in August during mid-term years before rebounding after the summer. This pattern has appeared several times since 2013, particularly during 2014, 2018, and 2022.
Although each cycle had its own market conditions, they all followed a similar path. Specifically, $XRP posted gains in July, lost ground in August, and then recovered much of those losses in September. However, these rebounds did not immediately lead to a full market recovery.
How $XRP Performed in 2014
During the downtrend that continued into 2014, $XRP delivered a strong 36% gain in July 2014. However, the recovery did not last long. In August 2014, the token dropped 5.69%, extending the market weakness.
The selling pressure continued into September 2014, when $XRP declined by another 4.51%. After that, the market changed direction.
Beginning in October 2014, $XRP recorded three straight monthly gains for the first time since its 2013 launch. During that rally, the token climbed 495%, rising from $0.0047 in October 2014 to $0.0280 by December 2014 before giving back part of those gains.
The Same Trend Appeared in 2018 and 2022
A similar pattern played out during the 2018 market downturn. After remaining under pressure for months, $XRP fell another 23% in August 2018, adding to the ongoing losses.
After reaching $0.3349, the token began to recover once summer ended. In September 2018, $XRP jumped 73% to $0.5812. Despite the strong rebound, the recovery did not last. The price later turned lower again, and the broader downtrend remained in place.
$XRP Performance in Mid-term Years
Meanwhile, during the 2022 downtrend, which became even more severe after the May 2022 Terra ecosystem collapse,$XRP saw losses in the first half of the year. However, the asset managed to post a 14.42% gain in July 2022.
This recovery proved temporary. In August 2022, $XRP fell 13.74%, continuing the pattern seen in previous mid-term years.
Once August ended, buyers returned, pushing the token up 46.79% in September 2022. However, this move did not start a full bull market. Instead, $XRP later pulled back again, while the broader bull run only began in November 2024, about two years later.
What the Pattern Could Mean for $XRP in 2026
The current market cycle shares several similarities with those earlier mid-term years. $XRP has remained in a prolonged downtrend throughout 2026, although July 2026 appears set to end with a modest gain. So far, the token has risen 3.91% during the month.
If the historical pattern repeats, $XRP could once again come under pressure in August 2026 as July draws to a close. History also suggests the token could recover in September 2026, as it did during previous mid-term years.
However, earlier cycles show that these post-summer rebounds did not mark the end of the broader downtrend or the beginning of a new bull market. Instead, $XRP usually gave up part of those gains before eventually entering a stronger and more sustained recovery.

 thecryptobasic.com