- Bitcoin cash price declined sharply after it failed to clear the $260 resistance against the US Dollar.
- The price is down more than 5% and it broke the key $245 support zone.
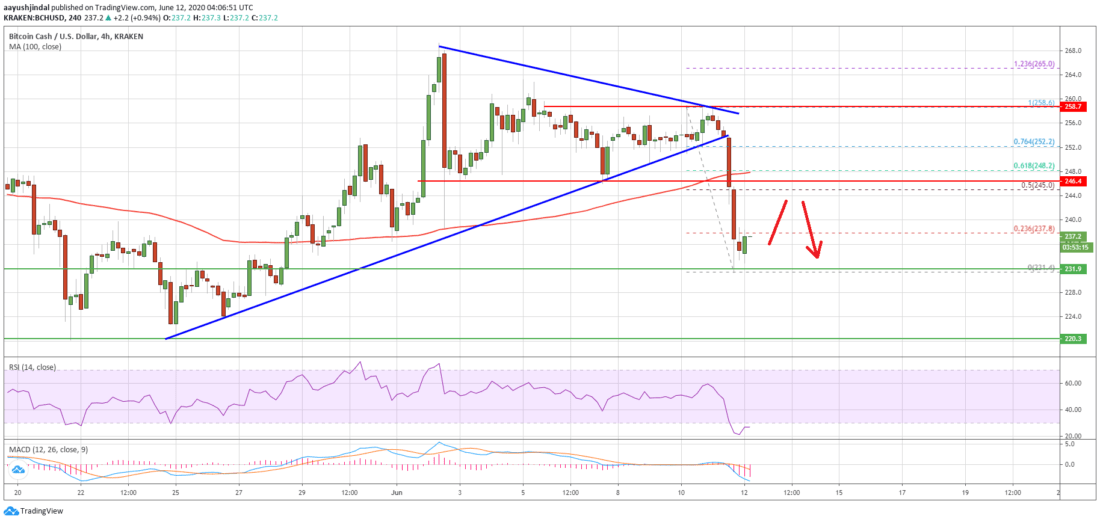
- There was a break below a crucial bullish trend line with support near $252 on the 4-hours chart of the BCH/USD pair (data feed from Coinbase).
- The pair is currently correcting higher, but upsides are likely to remain capped near $245.
Bitcoin cash price is back in a bearish zone below the $245 support against the US Dollar. BCH/USD is likely to continue lower as long as it is below $250.
Bitcoin Cash Price Analysis
Earlier this week, bitcoin cash price made a few attempts to clear the $258 and $260 resistance levels against the US Dollar. BCH formed a short-term top near the $258 level and recently the price started a major decline.
There was a break below the $250 support zone. The price even settled below the key $245 support and the 55 simple moving average (4-hours). Moreover, there was a break below a crucial bullish trend line with support near $252 on the 4-hours chart of the BCH/USD pair.
The pair even broke the $240 level and a new weekly low is formed near the $231 level. It is currently consolidating losses and correcting higher above $235.
An initial resistance is near the $238 level. It is close to the 23.6% Fib retracement level of the recent decline from the $258 high to $231 low.
The main resistance is now forming near the $245 level (the recent breakdown zone). It is close to the 50% Fib retracement level of the recent decline from the $258 high to $231 low.
To start a strong increase, the price must settle above the $250 level and the 55 simple moving average (4-hours). Conversely, the price is likely to continue lower once the current correction wave is complete near $245 or $250.
On the downside, an initial support is near the $230 level, below which there is a risk of a larger decline towards the $220 level in the near term.
Bitcoin Cash Price
Looking at the chart, bitcoin cash price is clearly trading in a negative zone below the $245 level. Therefore, there are chances of more losses below the $230 level.
Technical indicators
4 hours MACD – The MACD for BCH/USD is currently gaining momentum in the bearish zone.
4 hours RSI (Relative Strength Index) – The RSI for BCH/USD is now well below the 30 level.
Key Support Levels – $230 and $220.
Key Resistance Levels – $245 and $250.