
 coinpaper.com

Solana is testing short-term support near $75 while a broader cup-and-handle structure keeps the long-term bullish case alive. Holding support could drive $SOL toward $80-$84, but the projected $1,000 target requires several major breakouts.
Solana Forms Long-Term Cup-and-Handle as $1,000 Target Emerges
Solana may be forming a multiyear cup-and-handle pattern, according to analyst CryptoCurb, who projects a possible move above $1,000 if $SOL completes a confirmed breakout. However, the bullish target remains highly speculative while price continues trading inside the pattern’s descending handle.
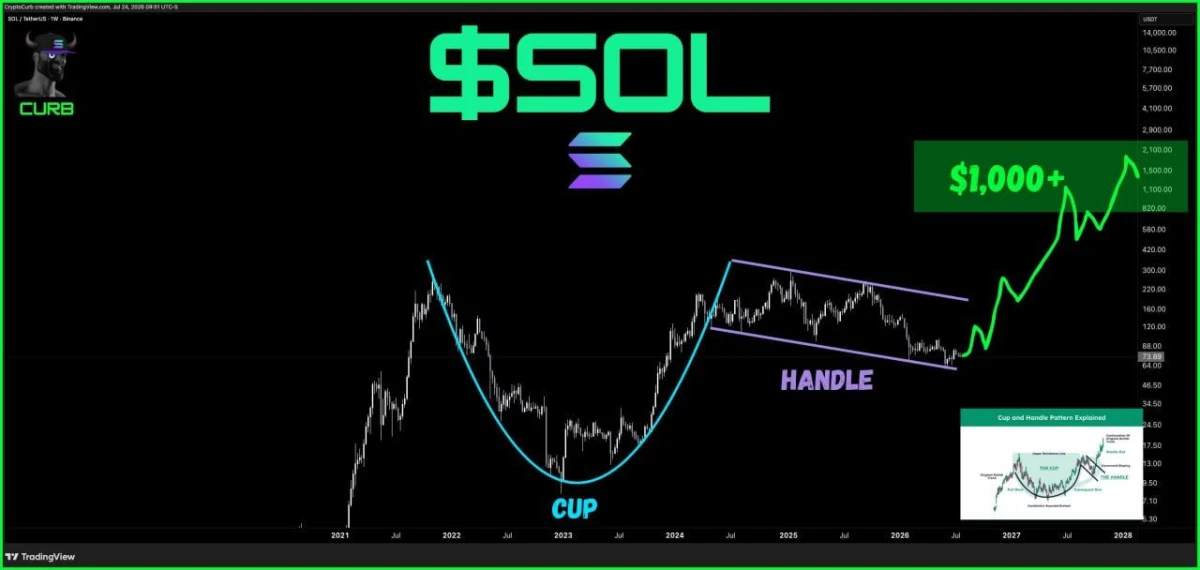
$SOL weekly chart. Source: CryptoCurb/TradingView
The chart places the rounded cup between Solana’s 2021 peak and its recovery into 2024. Since then, price has moved inside a downward-sloping channel, which the analyst identifies as the handle portion of the formation.
$SOL is trading near $74, close to the lower boundary of that channel. Holding the broader $64-$74 region would preserve the pattern and could provide a base for another attempt to recover.
However, a cup-and-handle setup is not confirmed until price breaks above the handle’s upper resistance. Based on the chart, $SOL would first need to reclaim the $120-$160 region before challenging stronger resistance near $200 and the previous highs around $250-$300.
A sustained breakout above those levels could support a long-term price expansion, although the move toward $1,000 would require substantial growth and several intermediate breakouts. The chart’s projected path should therefore be treated as a potential scenario rather than a confirmed forecast.
Meanwhile, a decisive breakdown below approximately $64 would weaken the structure and raise the risk that the handle develops into a broader continuation of Solana’s downtrend.
Solana Tests $75 Support as Bulls Target $80 Breakout
Solana is testing a key support zone near $75 after retreating from recent highs. Analyst AnnieShr said a successful defense of the area could support a recovery toward $79 to $80 before $SOL attempts a larger breakout above $82.
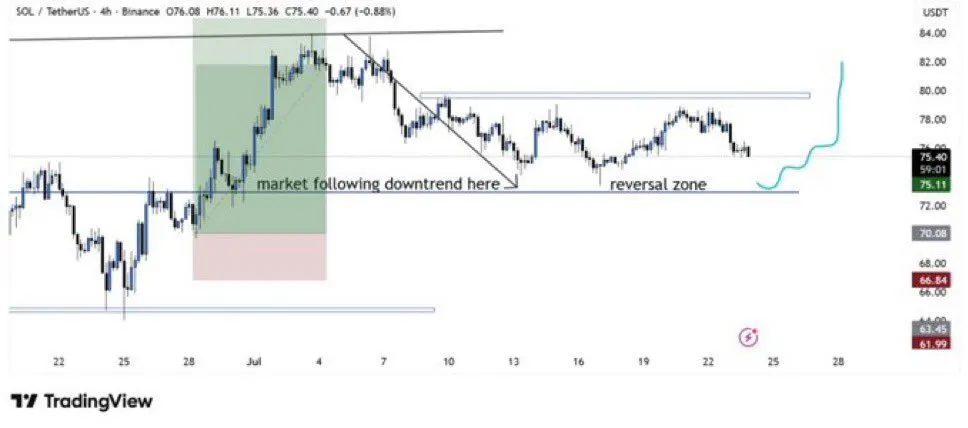
$SOL four-hour chart. Source: AnnieShr/TradingView
The chart shows Solana returning to the same region that previously acted as resistance before its late-June rally. Holding this level could confirm that buyers are turning the former breakout area into support.
The first major obstacle sits near $79 to $80, where price has faced repeated rejection. A confirmed four-hour close above that range could restore bullish momentum and open the path toward $82 and the previous high near $84.
However, $SOL remains vulnerable while trading below resistance. A decisive break under $75 would weaken the reversal setup and could expose the lower support near $70.
Further selling could bring the $66 to $63 region back into focus. For now, $75 remains the key level separating a possible rebound from another corrective move.