
 coinpaper.com
Solana is showing strength against both the U.S. dollar and Bitcoin as two bullish setups develop across different timeframes. Holding $74–$76 could support a move toward $94, while a long-term $SOL/$BTC breakout would strengthen the outperformance case.
$SOL/$BTC Tests Monthly Support as Bottoming Signs Emerge
Solana is testing a long-term support zone against Bitcoin that previously acted as resistance during the 2021 cycle. Analyst CryptoCurb believes the $SOL/$BTC pair has formed a bottom and could begin a period of relative outperformance.
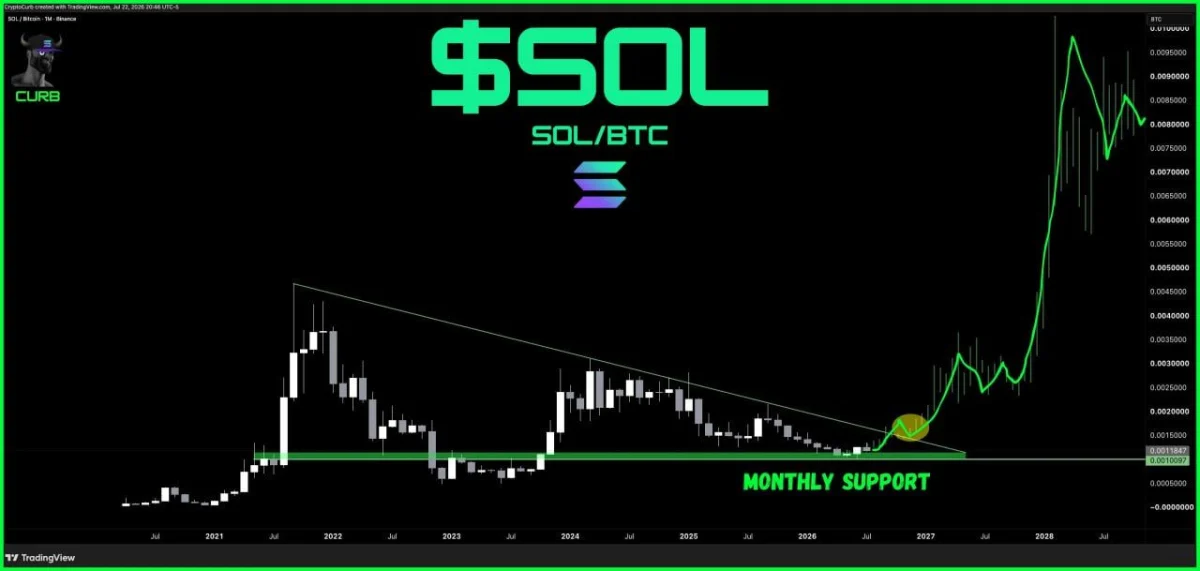
$SOL/$BTC monthly chart. Source: CryptoCurb/X
The pair must first hold support around 0.0010–0.0012 $BTC and break its multiyear descending trendline. Reclaiming 0.0015 $BTC, followed by 0.0020 $BTC, would provide stronger confirmation that momentum is shifting toward Solana.
However, the chart’s projected rise remains speculative and does not confirm that $SOL will outperform Bitcoin. A monthly close below the support zone would invalidate the bottoming setup and signal continued relative weakness.
Solana Retests Bull Flag Breakout Above 200 EMA
Solana has broken above a four-hour bull flag and is now retesting the former resistance line as support. Analyst BATMAN noted that $SOL also remains above its 200-period exponential moving average, keeping the short-term structure bullish.
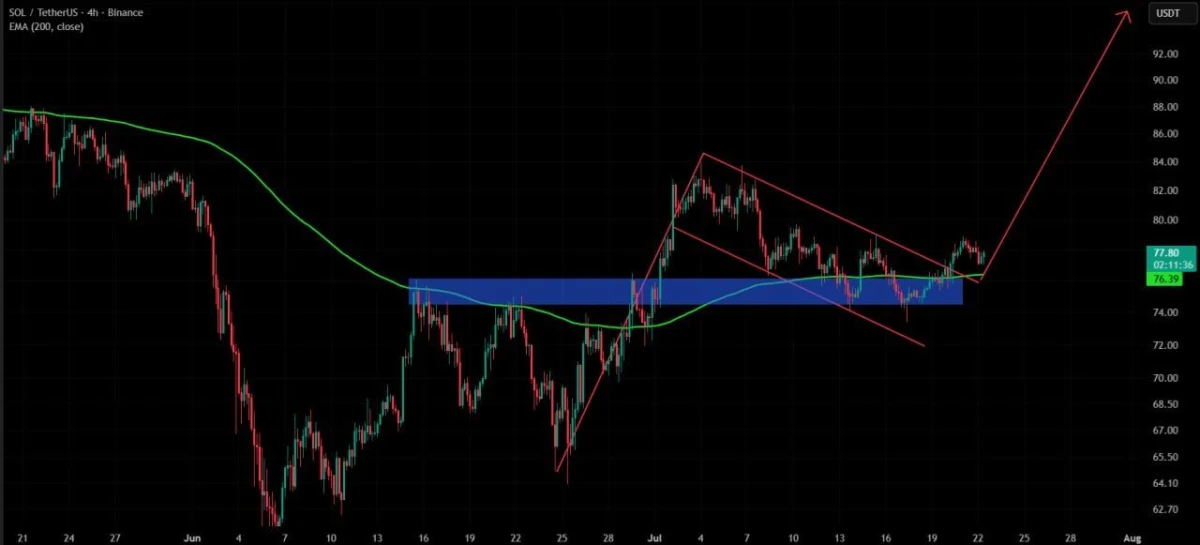
$SOL four-hour chart. Source: BATMAN/X
The main support area sits around $74–$76, including the 200 EMA and the previous breakout zone. Holding this region could support another move toward $82–$84, followed by the projected target near $94.
However, the breakout needs renewed buying momentum to continue. A confirmed move below the 200 EMA and $74 support would invalidate the setup and expose lower levels around $72 and $68.